IBOV 175,380.00 ▲ 0.46% IPSA 11,450.75 ▼ 0.76% IPC MEX 66,293.07 ▲ 0.79% MERVAL 3,009,029 — 0.00% COLCAP 2,508.47 ▼ 0.09% BVL PERÚ 60,117.56 ▲ 0.55% USD/BRL5.15▲ 0.09% USD/MXN16.96▲ 0.08% USD/CLP918.04▲ 0.52% USD/COP3,108▲ 1.44% USD/PEN3.34▼ 0.33% USD/ARS1,514▲ 0.15% USD/UYU40.18▲ 1.55% USD/PYG5,957▲ 0.99% USD/BOB11.50▲ 1.47% USD/DOP58.15▼ 0.27% USD/CRC450.21▲ 2.07% USD/GTQ7.62▲ 2.21% USD/HNL26.82▲ 0.34% USD/NIO36.62▲ 0.09% USD/VES785.55▼ 0.13% USD/PAB1.00— 0.00% USD/BZD2.00— 0.00% USD/JMD 157.28 — 0.00% USD/TTD6.73▲ 1.10% EUR/BRL6.00▼ 0.08% BRENT 88.88 ▼ 0.03% WTI 83.11 ▼ 0.11% IRON ORE 161.91 — — COPPER 6.61 ▲ 0.03% GOLD 4,461 ▲ 1.78% SILVER 65.59 ▲ 1.26% SOY 1,184 ▲ 3.20% CORN 480.50 ▲ 10.02% WHEAT 655.00 ▲ 3.93% COFFEE 317.25 ▼ 5.51% SUGAR 16.43 ▼ 1.79% ORANGE JUICE 138.55 ▼ 0.47% COTTON 85.03 ▲ 2.33% COCOA 5,719 ▲ 3.18% BEEF 223.60 ▼ 3.93% CATTLE 339.10 ▼ 3.16% LITHIUM 75.20 ▲ 1.47% PETR4 41.64 ▼ 0.05% VALE3 72.97 ▲ 0.83% ITUB4 38.60 ▼ 1.03% BBDC4 16.85 ▲ 0.36% ABEV3 14.89 ▼ 0.80% BBAS3 19.37 ▲ 0.47% B3SA3 14.26 ▼ 0.21% WEGE3 47.59 ▲ 0.49% PRIO3 59.14 ▼ 0.19% SUZB3 41.33 ▲ 2.35% RENT3 34.68 ▼ 0.09% AZZA3 15.89 ▼ 2.63% CSAN3 3.22 ▼ 1.83% RAIZ4 0.25 — 0.00% PCAR3 2.75 ▼ 0.36% GMAT3 3.65 ▼ 1.08% PSSA3 48.13 ▼ 0.54% CVCB3 1.33 ▼ 2.92% POSI3 3.36 ▲ 2.44% SLCE3 13.34 ▲ 0.30% NATU3 8.14 ▼ 0.73% IBOV 175,380.00 ▲ 0.46% IPSA 11,450.75 ▼ 0.76% IPC MEX 66,293.07 ▲ 0.79% MERVAL 3,009,029 — 0.00% COLCAP 2,508.47 ▼ 0.09% BVL PERÚ 60,117.56 ▲ 0.55% USD/BRL 5.16 ▲ 0.01% USD/MXN 17.06 ▼ 0.24% USD/CLP 913.98 ▲ 0.04% USD/COP 3,140 ▲ 0.03% USD/PEN 3.36 ▼ 0.66% USD/ARS 1,493 ▲ 0.10% USD/UYU 40.27 ▲ 1.24% USD/PYG 5,939 ▲ 1.68% USD/BOB 11.64 ▼ 0.76% USD/DOP 58.34 ▲ 1.25% USD/CRC 445.92 ▲ 0.89% USD/GTQ 7.62 ▲ 2.21% USD/HNL 26.79 ▲ 1.57% USD/NIO 36.62 ▲ 0.69% USD/VES 762.44 ▼ 0.13% USD/PAB 1.00 — 0.00% USD/BZD 2.00 — 0.00% USD/JMD 157.28 — 0.00% USD/TTD 6.70 ▲ 0.61% EUR/BRL 5.95 ▲ 1.01% BRENT 88.88 ▼ 0.03% WTI 83.11 ▼ 0.11% IRON ORE 161.91 — — COPPER 6.61 ▲ 0.03% GOLD 4,461 ▲ 1.78% SILVER 65.59 ▲ 1.26% SOY 1,184 ▲ 3.20% CORN 480.50 ▲ 10.02% WHEAT 655.00 ▲ 3.93% COFFEE 317.25 ▼ 5.51% SUGAR 16.43 ▼ 1.79% ORANGE JUICE 138.55 ▼ 0.47% COTTON 85.03 ▲ 2.33% COCOA 5,719 ▲ 3.18% BEEF 223.60 ▼ 3.93% CATTLE 339.10 ▼ 3.16% LITHIUM 75.20 ▲ 1.47% PETR4 41.64 ▼ 0.05% VALE3 72.97 ▲ 0.83% ITUB4 38.60 ▼ 1.03% BBDC4 16.85 ▲ 0.36% ABEV3 14.89 ▼ 0.80% BBAS3 19.37 ▲ 0.47% B3SA3 14.26 ▼ 0.21% WEGE3 47.59 ▲ 0.49% PRIO3 59.14 ▼ 0.19% SUZB3 41.33 ▲ 2.35% RENT3 34.68 ▼ 0.09% AZZA3 15.89 ▼ 2.63% CSAN3 3.22 ▼ 1.83% RAIZ4 0.25 — 0.00% PCAR3 2.75 ▼ 0.36% GMAT3 3.65 ▼ 1.08% PSSA3 48.13 ▼ 0.54% CVCB3 1.33 ▼ 2.92% POSI3 3.36 ▲ 2.44% SLCE3 13.34 ▲ 0.30% NATU3 8.14 ▼ 0.73%
since 2009
Wednesday, August 26, 2026

Real Estate Brazil

Solid growth in real estate sales in the city of São Paulo, sharp decline in new launches

By · September 2, 2022 · 2 min read

Daily Brief

The morning intel from across Latin America. Free.

By subscribing you agree to our privacy policy. We never share your email.

The residential real estate market in São Paulo had sales expansion in July, while starts shrank, according to a survey released by the Housing Union (Secovi-SP) on Friday, 2.

The survey showed the sale of 5,955 new housing units in the capital of São Paulo in July, a result 10.8% higher than the same month of 2021.

The value of homes sold in July amounted to R$2.77 billion (US$527 million), an increase of 1.6% year on year.

The sales pace (percentage of units sold compared to launches and inventory) decreased to 8.5% in July from 10.2% a year earlier.
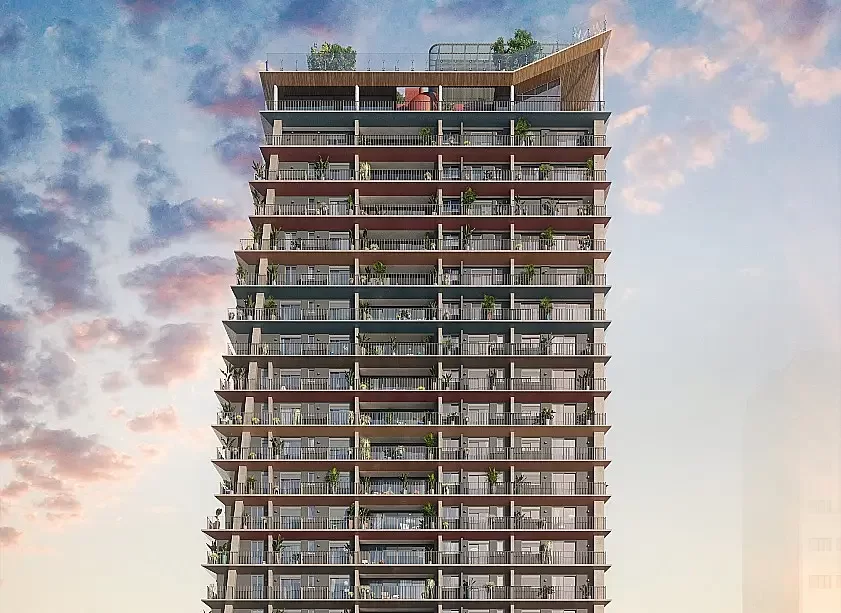
Real estate sales in July grow by 10.8% in the city of São Paulo. (Photo internet reproduction)
Real estate sales in July grew by 10.8% in the city of São Paulo. (Photo internet reproduction)
One-stop reference
Company Intelligence
Every listed company in Latin America — financials, ownership and structure for 1,450+ companies across 26 exchanges, in one place.
Browse the directory →
RT
Ask Rio Times
17 years of Latin America reporting, on demand.
Open the full Ask Rio Times →

In the cumulative 12 months (August 2021 to July 2022), 69,647 units were sold, an increase of 6.4% compared to the previous period (August 2020 to July 2021).

In terms of value, R$35.2 billion was sold in the last 12 months, a decrease of 3.4%. The sales pace in 12 months decreased to 53% from 59% in the previous period.

LAUNCHES

In July, 4,500 housing units were launched in the city of São Paulo, 35.1% less than in July of the previous year.

A total of 84,247 units were placed on the market in São Paulo during the 12 months, 3.0% more than in the previous period.

INVENTORY

The state capital of São Paulo ended the month of July with an inventory of 64,181 units for sale, taking into account properties in the planning stage, properties under construction, and newly built properties.

The number of properties offered was 36.4% higher than in July 2021.

This article was produced by The Rio Times’ automated newsroom system. How we use AI · Report an error

Read More from The Rio Times

The Rio Times · Power Map
See who really holds power in Latin America
Click to open the Power Map

Rotate for Best Experience

This report is optimized for landscape viewing. Rotate your phone for the full experience.