IBOV 209,066.90 ▲ 1.38% IPSA 11,043.36 ▲ 0.17% IPC MEX 66,048.57 ▲ 1.63% MERVAL 2,828,027 ▼ 0.16% COLCAP 2,531.15 ▲ 0.21% BVL PERÚ 59,610.00 ▲ 2.26% USD/BRL4.99▼ 0.01% USD/MXN18.39▼ 0.01% USD/CLP975.06— 0.00% USD/COP3,188▲ 0.06% USD/PEN3.43▼ 0.01% USD/ARS1,517— 0.00% USD/UYU40.21— 0.00% USD/PYG5,676— 0.00% USD/BOB11.77— 0.00% USD/DOP60.87— 0.00% USD/CRC450.81— 0.00% USD/GTQ7.64— 0.00% USD/HNL26.86— 0.00% USD/NIO36.62▲ 0.31% USD/VES873.46▼ 0.26% USD/PAB1.00— 0.00% USD/BZD2.00— 0.00% USD/JMD 157.28 — 0.00% USD/TTD6.75— 0.00% EUR/BRL5.58▼ 0.68% BRENT 88.88 ▼ 0.03% WTI 83.11 ▼ 0.11% IRON ORE 161.91 — — COPPER 6.61 ▲ 0.03% GOLD 4,461 ▲ 1.78% SILVER 65.59 ▲ 1.26% SOY 1,184 ▲ 3.20% CORN 480.50 ▲ 10.02% WHEAT 655.00 ▲ 3.93% COFFEE 317.25 ▼ 5.51% SUGAR 16.43 ▼ 1.79% ORANGE JUICE 138.55 ▼ 0.47% COTTON 85.03 ▲ 2.33% COCOA 5,719 ▲ 3.18% BEEF 223.60 ▼ 3.93% CATTLE 339.10 ▼ 3.16% LITHIUM 75.20 ▲ 1.47% PETR4 41.64 ▼ 0.05% VALE3 72.97 ▲ 0.83% ITUB4 38.60 ▼ 1.03% BBDC4 16.85 ▲ 0.36% ABEV3 14.89 ▼ 0.80% BBAS3 19.37 ▲ 0.47% B3SA3 14.26 ▼ 0.21% WEGE3 47.59 ▲ 0.49% PRIO3 59.14 ▼ 0.19% SUZB3 41.33 ▲ 2.35% RENT3 34.68 ▼ 0.09% AZZA3 15.89 ▼ 2.63% CSAN3 3.22 ▼ 1.83% RAIZ4 0.25 — 0.00% PCAR3 2.75 ▼ 0.36% GMAT3 3.65 ▼ 1.08% PSSA3 48.13 ▼ 0.54% CVCB3 1.33 ▼ 2.92% POSI3 3.36 ▲ 2.44% SLCE3 13.34 ▲ 0.30% NATU3 8.14 ▼ 0.73% IBOV 209,066.90 ▲ 1.38% IPSA 11,043.36 ▲ 0.17% IPC MEX 66,048.57 ▲ 1.63% MERVAL 2,828,027 ▼ 0.16% COLCAP 2,531.15 ▲ 0.21% BVL PERÚ 59,610.00 ▲ 2.26% USD/BRL 5.16 ▲ 0.01% USD/MXN 17.06 ▼ 0.24% USD/CLP 913.98 ▲ 0.04% USD/COP 3,140 ▲ 0.03% USD/PEN 3.36 ▼ 0.66% USD/ARS 1,493 ▲ 0.10% USD/UYU 40.27 ▲ 1.24% USD/PYG 5,939 ▲ 1.68% USD/BOB 11.64 ▼ 0.76% USD/DOP 58.34 ▲ 1.25% USD/CRC 445.92 ▲ 0.89% USD/GTQ 7.62 ▲ 2.21% USD/HNL 26.79 ▲ 1.57% USD/NIO 36.62 ▲ 0.69% USD/VES 762.44 ▼ 0.13% USD/PAB 1.00 — 0.00% USD/BZD 2.00 — 0.00% USD/JMD 157.28 — 0.00% USD/TTD 6.70 ▲ 0.61% EUR/BRL 5.95 ▲ 1.01% BRENT 88.88 ▼ 0.03% WTI 83.11 ▼ 0.11% IRON ORE 161.91 — — COPPER 6.61 ▲ 0.03% GOLD 4,461 ▲ 1.78% SILVER 65.59 ▲ 1.26% SOY 1,184 ▲ 3.20% CORN 480.50 ▲ 10.02% WHEAT 655.00 ▲ 3.93% COFFEE 317.25 ▼ 5.51% SUGAR 16.43 ▼ 1.79% ORANGE JUICE 138.55 ▼ 0.47% COTTON 85.03 ▲ 2.33% COCOA 5,719 ▲ 3.18% BEEF 223.60 ▼ 3.93% CATTLE 339.10 ▼ 3.16% LITHIUM 75.20 ▲ 1.47% PETR4 41.64 ▼ 0.05% VALE3 72.97 ▲ 0.83% ITUB4 38.60 ▼ 1.03% BBDC4 16.85 ▲ 0.36% ABEV3 14.89 ▼ 0.80% BBAS3 19.37 ▲ 0.47% B3SA3 14.26 ▼ 0.21% WEGE3 47.59 ▲ 0.49% PRIO3 59.14 ▼ 0.19% SUZB3 41.33 ▲ 2.35% RENT3 34.68 ▼ 0.09% AZZA3 15.89 ▼ 2.63% CSAN3 3.22 ▼ 1.83% RAIZ4 0.25 — 0.00% PCAR3 2.75 ▼ 0.36% GMAT3 3.65 ▼ 1.08% PSSA3 48.13 ▼ 0.54% CVCB3 1.33 ▼ 2.92% POSI3 3.36 ▲ 2.44% SLCE3 13.34 ▲ 0.30% NATU3 8.14 ▼ 0.73%
since 2009
Sunday, October 11, 2026

Latest News Life & Society

Rental Affordability Crisis Looms in Brazil Despite Recent Slowdown

By · November 19, 2024 · 2 min read

Brazil’s rental market has entered a phase of deceleration, yet continues to outpace inflation. The FipeZAP Index, which tracks rental prices across 36 Brazilian cities, reveals a complex landscape.

Rental costs rose by 0.46% in October 2024, marking the fifth consecutive month of slowing growth. Despite this recent slowdown, the year-to-date increase stands at a substantial 11.41%.

This figure dwarfs the official inflation rate of 4.20% for the same period. The 12-month growth paints an even starker picture, with rents surging 13.48% compared to inflation’s 4.76%.

These numbers reflect a market grappling with various forces. Economic recovery has bolstered rental prices, while government housing initiatives continue to shape the sector.

The shift towards remote work has also altered housing preferences, driving demand for larger spaces. São Paulo leads the pack with the highest average rent at R$ 56.65 per square meter.
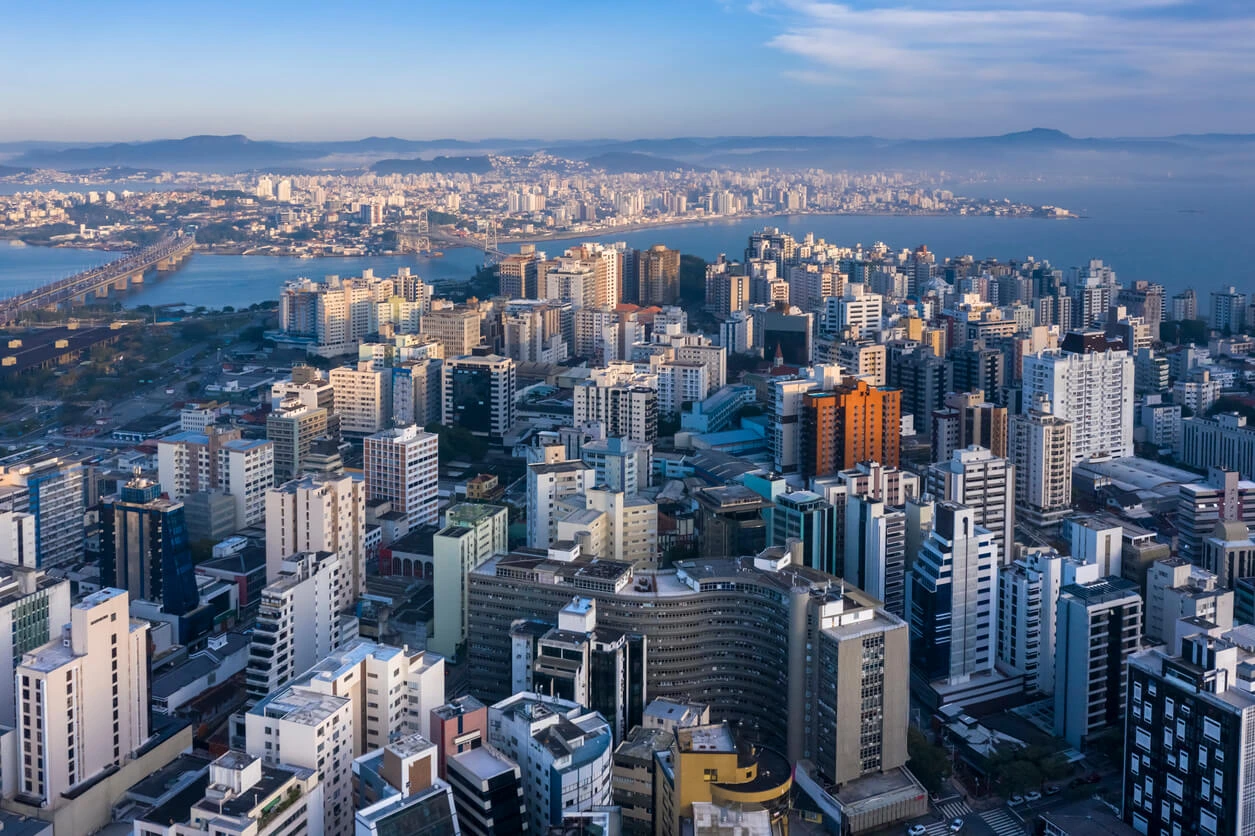
Rental Affordability Crisis Looms in Brazil Despite Recent Slowdown
Rental Affordability Crisis Looms in Brazil Despite Recent Slowdown.
RT
Ask Rio Times
17 years of Latin America reporting, on demand.
Open the full Ask Rio Times →

Florianópolis follows closely at R$ 53.99/m², with Recife, Maceió, and Belém rounding out the top five. The national average rental price in October reached R$ 47.05 per square meter.

The LatAm Brief

One email, every weekday morning. What moved in Latin American markets, politics and expat life.

Yesterday’s subject line: “Panama quake hits hotel and cathedral, canal keeps running”

Free. We send a confirmation link first — nothing arrives until you click it. Unsubscribe with one click in any edition. If you stop opening us for 30 days we stop sending by ourselves, as we assume the interest is no longer there. See our privacy policy. We never share your email.

Brazil’s Evolving Rental Market

Interestingly, smaller properties command higher per-square-meter prices. One-bedroom apartments averaged R$ 61.99/m², while three-bedroom units stood at R$ 40.98/m².

This trend underscores the demand for compact, centrally-located living spaces in urban centers. The rental market’s performance varies significantly across regions.

Salvador has consistently shown the highest price increases among surveyed cities. Porto Alegre has also emerged as a standout in recent rankings, indicating shifting dynamics across Brazil.

While the recent deceleration might offer some relief to tenants, affordability remains a pressing concern. The gap between rental growth and general inflation suggests ongoing challenges for many Brazilians.

This situation calls for a balanced approach to housing policies. As Brazil moves forward, the rental market will likely continue to evolve. Economic trends, government policies, and changing lifestyle preferences will shape its future.

The balance between urban concentration and suburban expansion will play a crucial role in this evolution. The rental market’s performance serves as a barometer for broader economic trends.

It reflects not only housing demand but also economic confidence and urban development patterns. As such, its trajectory warrants close attention from policymakers and citizens alike.

This article was produced by The Rio Times’ automated newsroom system. How we use AI · Report an error · Editorial responsibility: Matthias Camenzind, Editor-in-Chief

The Rio Times · Power Map
See who really holds power in Latin America
Click to open the Power Map →

Rotate for Best Experience

This report is optimized for landscape viewing. Rotate your phone for the full experience.