Kenya Charcoal Prices Hit 78-Month High, Squeezing Urban Households
Kenya · ENERGY
Key Facts
—Retail price: The Kenya National Bureau of Statistics reported an average retail charcoal price of Sh96.79 (about US$0.75) per kilogramme in June 2026.
—Price movement: The June 2026 average of Sh96.79 per kilogramme was up from about Sh83.80 per kilogramme in June 2024, based on official KNBS price data.
—Historical peak: Business Daily described the June 2026 price as a 78-month high for Kenyan charcoal, the highest since January 2020.
—Household burden: In Mombasa, energy accounted for 14 to 35 percent of household budgets, with charcoal representing 10 to 25 percent of energy spending, according to research on Kenya’s charcoal sector.
—Regional dependence: Charcoal is used by as much as 80 percent of the urban population in East Africa as a primary cooking energy source, according to a policy brief.
—Policy effect: Research found consumer prices more than doubled in some areas after Kenya’s charcoal ban, rising from 7.8 US dollars per bag before the ban to 16.5 US dollars per bag after.
Kenya charcoal prices reached Sh96.79 (about US$0.75) per kilogramme in June 2026, a 78-month high that is forcing low-income urban households to spend more of their budgets on a basic cooking fuel they cannot easily replace.
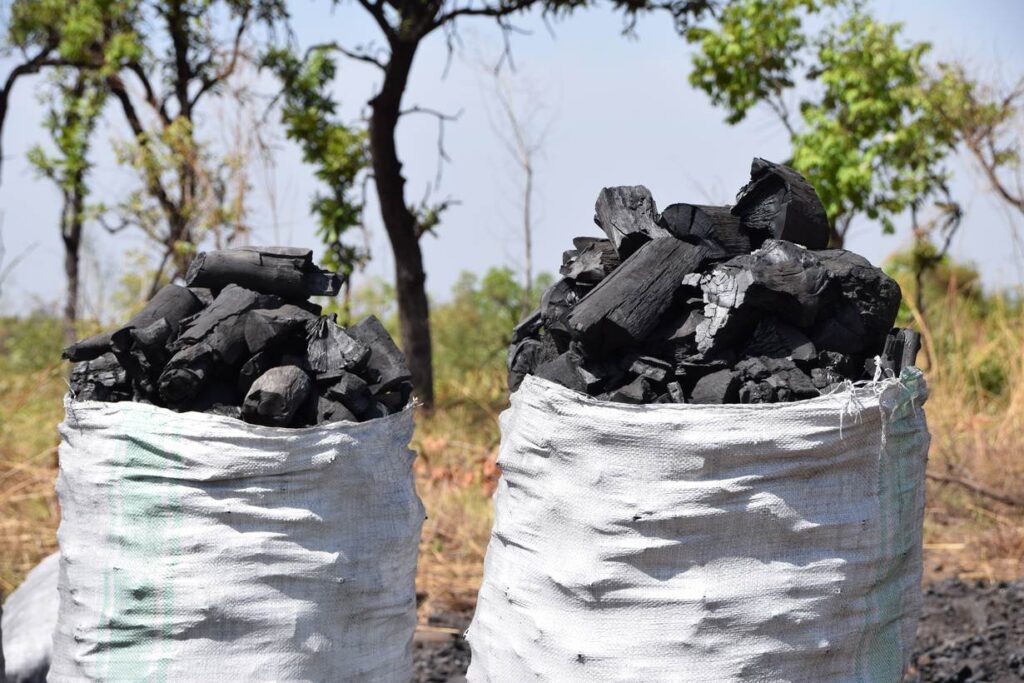
What the official data shows about Kenya charcoal prices
The Kenya National Bureau of Statistics reported the average retail price of charcoal at Sh96.79 (about US$0.75) per kilogramme in June 2026. Business Daily described the figure as a 78-month high for the commodity, the highest since January 2020, when it stood at Sh152.25 per kilogramme.
Business Daily reported the June 2026 average was up from about Sh83.80 per kilogramme in June 2024, based on KNBS price data, and linked the sustained rise to the government’s 2018 logging ban, persistent household demand and the rising cost of alternative fuels such as liquefied petroleum gas and kerosene. That jump is far above the pace of general inflation and lands directly on households that cook with charcoal daily.
The price rise is not an isolated event. Earlier market snapshots during a logging-ban period showed a four-kilogramme tin selling at Sh84.5 in February, up from Sh79.7 a year earlier, while some areas reported a bag at Sh2,500 and a four-kilogramme tin around Sh120.
Why households feel the squeeze first
Low-income consumers buy charcoal in small quantities several times a week, which makes them more exposed to stockouts and retail mark-ups than households that can afford bulk purchases. When supply tightens, the poorest buyers are the first to pay more.
Research on Kenya’s charcoal sector found that in Mombasa, energy accounted for 14 to 35 percent of household budgets, with charcoal alone representing 10 to 25 percent of energy spending. A price spike of this scale therefore cuts directly into money available for food, rent and school fees.
The alternatives are not always realistic. Studies conclude that punitive charcoal policies can worsen livelihoods for both producers and consumers, with the poorest households least able to shift to liquefied petroleum gas or paraffin when those fuels also become more expensive.
The money and power behind the charcoal trade
Charcoal is not simply a cooking fuel. It is a rent-generating commodity controlled by dealers, transporters and wholesalers who often have better access to capital, information and political connections than the small producers who cut and burn the wood.
Scholarship on African charcoal markets describes them as embedded in resource complexes and “energopolitics,” where access to trees, land, transport and legitimacy determines who captures profits. In Kenya, policy interventions that restrict production can unintentionally strengthen middlemen and grey-market supply chains, because the physical product remains in demand even when formal supply is constrained.
Research on Kenya’s charcoal ban found consumer prices more than doubled in some areas after the restriction took effect. Average consumer prices rose from 7.8 US dollars per bag before the ban to 16.5 US dollars per bag after, while small retail packs climbed from 0.5 US dollars to 1 US dollar per kilogramme.
A regional energy story with geopolitical edges
The Kenyan case sits inside a larger East African energy picture. One policy brief says charcoal is used by as much as 80 percent of the urban population in East Africa as a primary cooking energy source, making price movements a matter of broad political sensitivity.
Regional trade is often cross-border and informal, with bans in one country shifting supply to neighbours and weakening enforcement. In the Horn of Africa, charcoal has been tied to conflict financing and Gulf demand, with United Nations and sanctions-era reporting on Somalia documenting charcoal trade revenues supporting al-Shabaab while Gulf states continued importing Somali charcoal despite bans.
Academic work argues Gulf Cooperation Council states’ demand for Somali charcoal and their broader competition for influence in the Horn have fed patronage networks and intensified regional instability. Charcoal is not a strategic mineral, but it illustrates the same logic of resource dependence, rents and political leverage that shapes the wider competition covered by Africa: The New Scramble.
What to watch next
The immediate losers from the June 2026 price level are low-income families in Nairobi, Mombasa and other urban centres who cannot easily switch fuels. The winners tend to be well-connected intermediaries who can arbitrage scarcity and move product through informal channels.
The next data release from the Kenya National Bureau of Statistics will show whether the Sh96.79 per kilogramme level was a peak or the start of a longer climb. Any new enforcement action on charcoal production or transport would likely push prices higher still, given the pattern documented in earlier ban periods.
For investors and policy watchers, the signal is clear: charcoal pricing in Kenya is a barometer of household stress, regulatory pressure and informal market power all at once. It deserves attention well beyond the kitchen.
Frequently Asked Questions
How much did charcoal cost in Kenya in June 2026?
The Kenya National Bureau of Statistics reported an average retail price of Sh96.79 (about US$0.75) per kilogramme in June 2026, which Business Daily described as a 78-month high.
Why are Kenya charcoal prices rising so sharply?
Supply restrictions, enforcement actions and informal market control by dealers and transporters all contribute to price spikes, with research showing bans can more than double consumer prices in affected areas.
Who is most affected by high charcoal prices in Kenya?
Low-income urban households are hit hardest because they buy charcoal in small quantities several times a week and have limited ability to switch to alternatives such as liquefied petroleum gas or paraffin.
Connected Coverage
Kenya’s charcoal squeeze is one example of how resource dependence, rents and political leverage shape African energy markets, a theme explored in depth at Africa: The New Scramble.
Sources
This article was produced by The Rio Times’ automated newsroom system. How we use AI · Report an error · Editorial responsibility: Matthias Camenzind, Editor-in-Chief
LatAm Markets: Live Signals → — real-time movers, turnover leaders and FX across Latin America.
Read More from The Rio Times