Iron Ore Slips Below $100 Mark as China Demand Concerns Persist
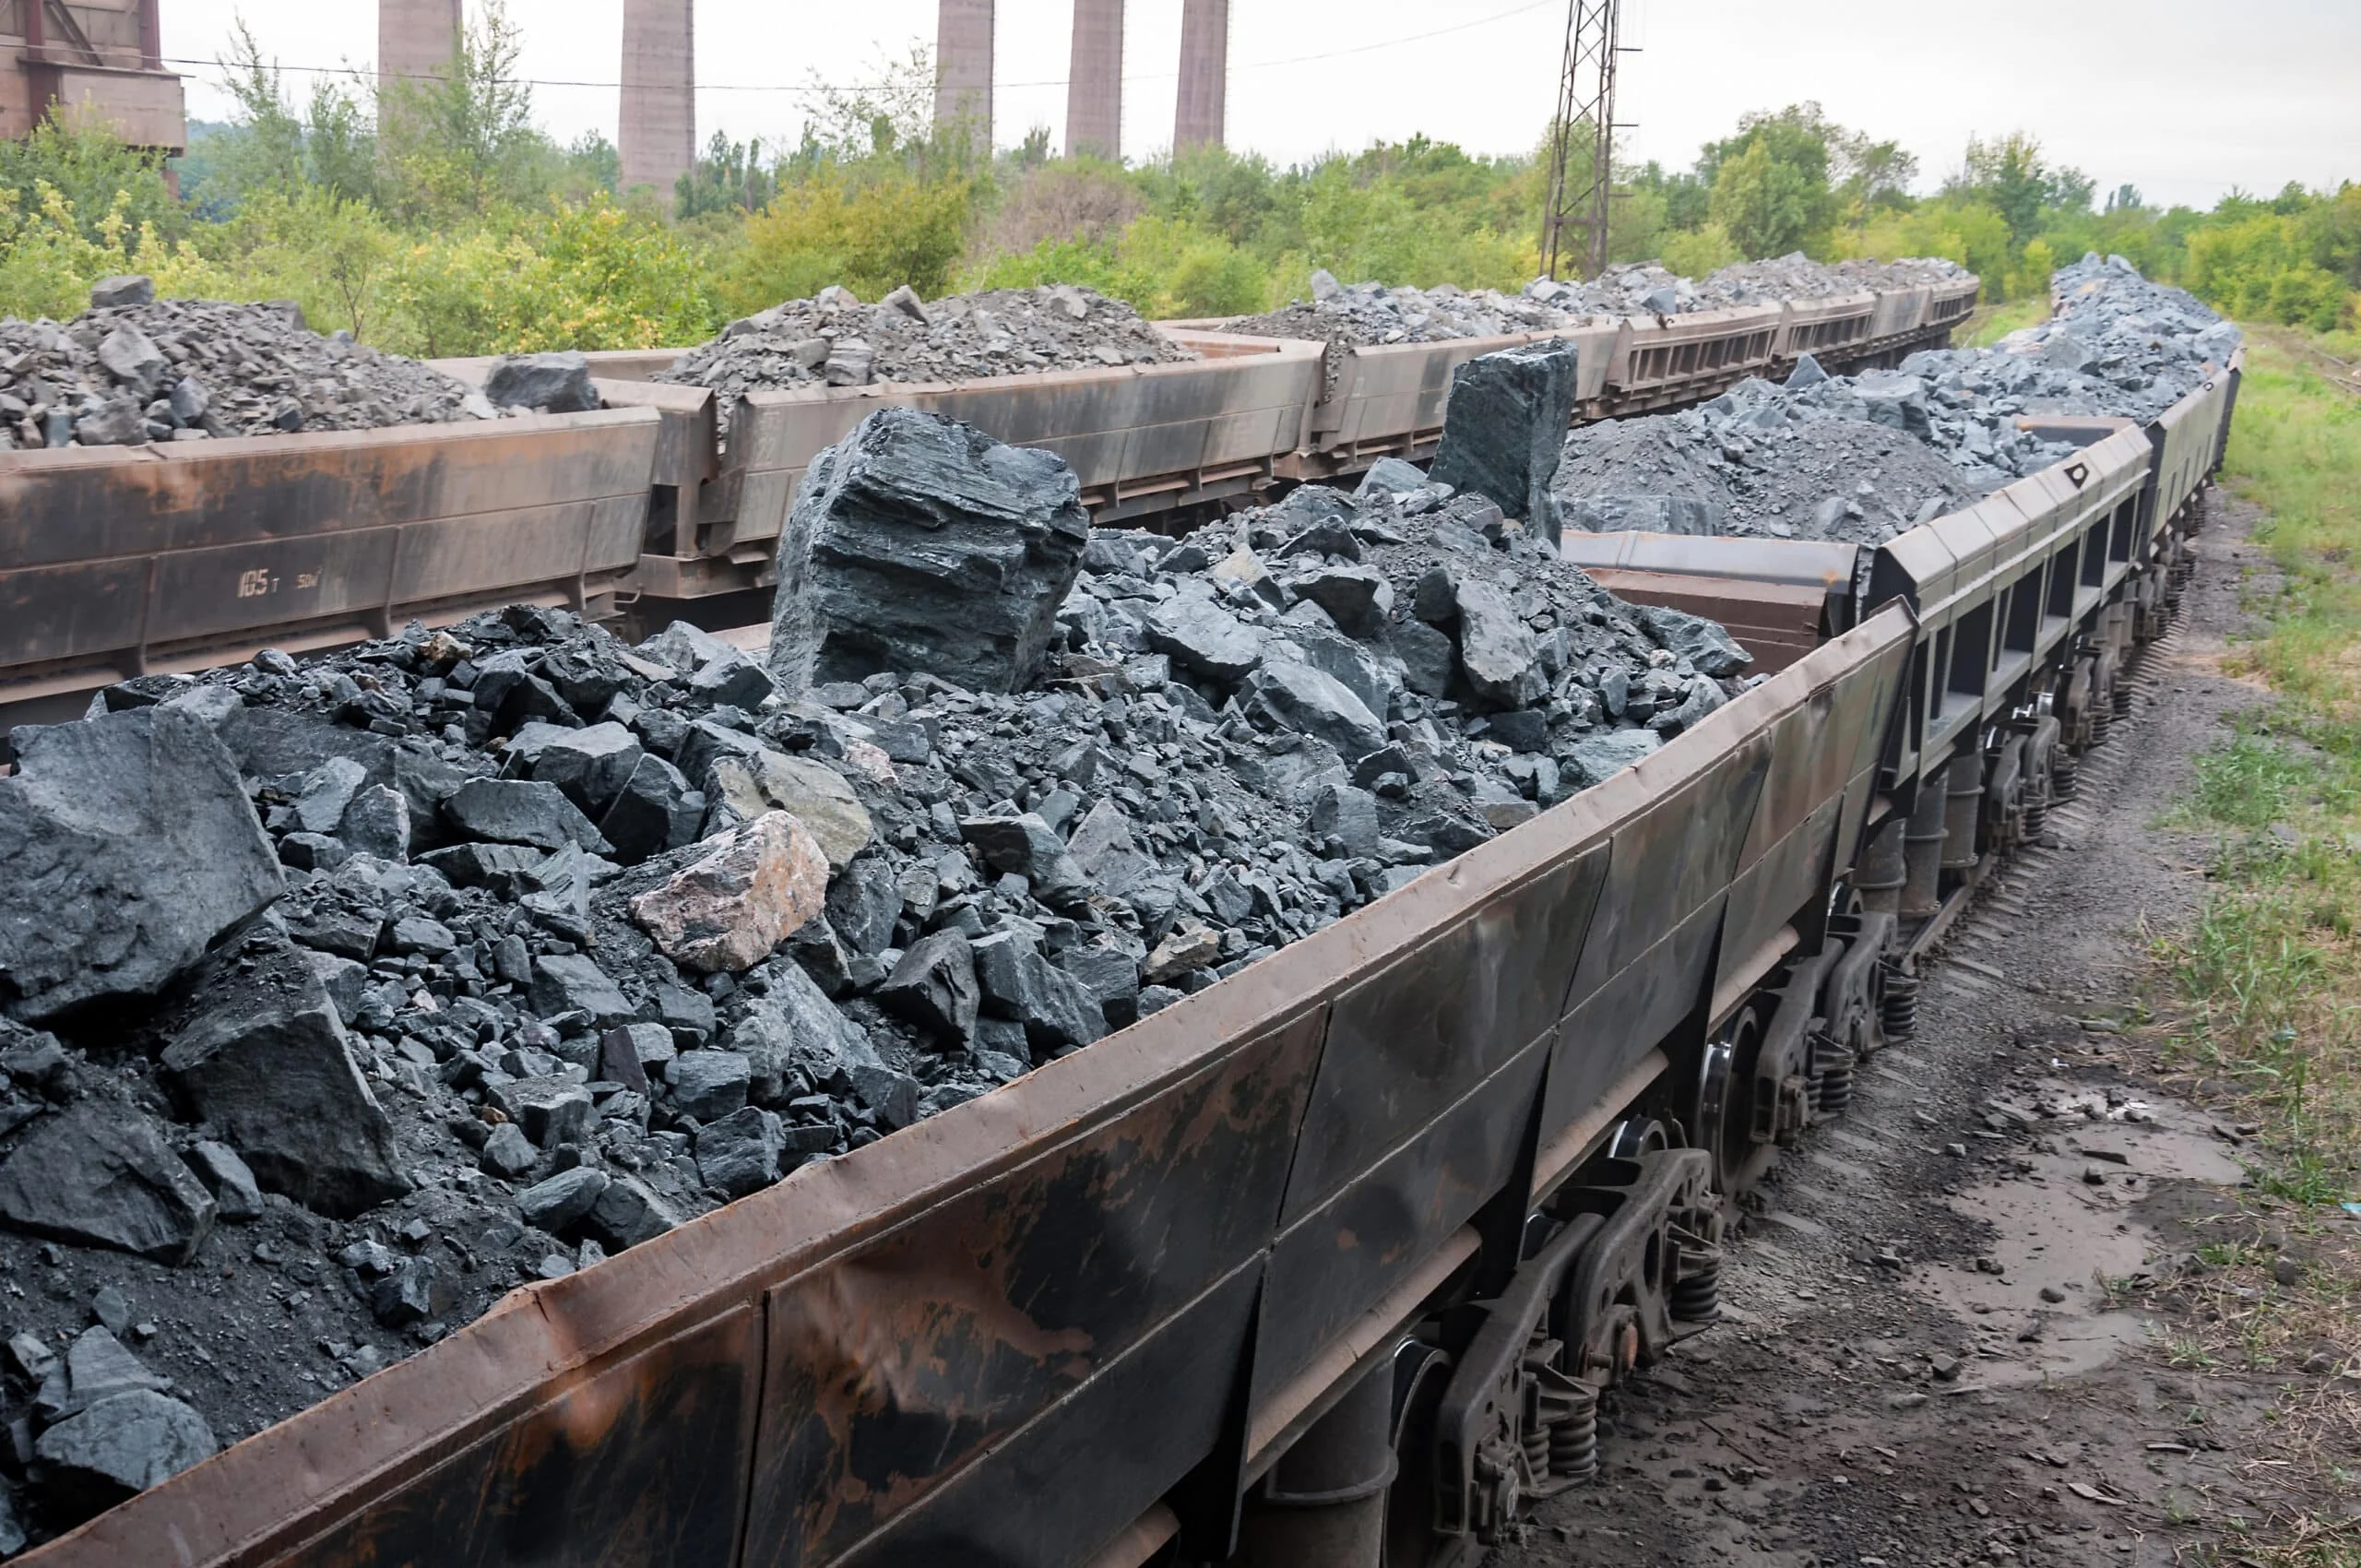
Iron ore prices continued their downward trend with the SGX TSI Iron Ore CFR China (62% Fe Fines) Index opening at $96.65 on Friday morning, May 2, 2025.
The benchmark price reflects a slight decline of 0.10 (-0.10%) today, extending losses that began in mid-April when prices first dropped below the psychologically important $100 per tonne level.
Market analysts attribute the bearish momentum to persistent concerns about Chinese demand. Steel mills across China have shifted from restocking to just-in-time purchasing as manufacturing activity showed signs of contraction in April.
Blast furnace utilization rates have stabilized at 82.3%, indicating a cautious approach from producers facing margin pressures. The technical picture reinforces the negative outlook. SGX Iron Ore futures continue testing key support at $95.40, with momentum indicators firmly bearish.
The Relative Strength Index trends lower but remains above oversold territory. Meanwhile, the MACD crossed below zero earlier in April, confirming the bearish signal that began forming in late March.

Chinese port inventories reached 138 million metric tons last week, showing a modest 1.4% week-on-week decline. This balanced inventory level suggests neither acute shortage nor severe oversupply currently influences price action.
Price Sensitivity and Seasonal Pressures
Major iron ore producers maintain relatively steady output despite the price decline. Rio Tinto exported 69.91 million tonnes from Western Australia in Q1 2025, down 6.75% year-over-year. Vale’s exports from Brazil totaled 55.40 million tonnes, falling 4.17% compared to the same period last year.
“The current iron ore market exhibits classic late-cycle behavior,” according to a recent MMi Market Intelligence report. “Completed restocking activities suggest we’re entering a more price-sensitive phase.”
UBS analysts forecast iron ore prices to average around $100 per ton throughout 2025, with a slight decrease expected in 2026-2027. They identify $85 per ton as a robust support level based on the 90th percentile of the global cost curve.
Seasonal factors may add more pressure in the coming months. Construction activity typically declines 7-9% from May to July in northern China, potentially weakening demand further.
Traders now watch for potential policy announcements from Beijing regarding infrastructure investment. Such stimulus measures could significantly impact price direction in the near term, potentially offsetting some of the current bearish momentum if implemented aggressively.
The market expects slightly increased volatility ahead of China’s five-day Labor Day holiday, which begins tomorrow.
Live Market IntelligenceCommodities — Live Market Board
Rio Times · Live Market Intelligence
Commodities — Live Market Board
-0.03%
| Instrument | Last | Change | YoY | Prev. | High | Low | Volume |
|---|---|---|---|---|---|---|---|
| GOLD | 4,461 | +1.78% | +33.20% | 4,383 | 4,503 | 4,421 | 139,824 |
| SILVER | 65.59 | +1.26% | +73.05% | 64.77 | 66.98 | 64.81 | 46,406 |
| BRENT | 88.88 | -0.03% | +34.42% | 88.91 | 90.07 | 88.12 | 29,713 |
| WTI | 83.11 | -0.11% | +31.57% | 83.20 | 84.35 | 82.40 | 166,848 |
| COPPER | 6.61 | +0.03% | +46.70% | 6.61 | 6.71 | 6.61 | 39,543 |
| LITHIUM | 75.20 | +1.47% | +62.95% | 74.11 | 75.80 | 75.08 | 89,275 |
| IRON ORE | 161.91 | — | +58.10% | 161.91 | 161.91 | 1 | |
| SOY | 1,184 | +3.20% | +17.05% | 1,148 | 1,199 | 1,168 | 163,179 |
| CORN | 480.50 | +10.02% | +29.34% | 436.75 | 480.75 | 459.50 | 341,248 |
| WHEAT | 655.00 | +3.93% | +29.70% | 630.25 | 657.75 | 631.50 | 128,793 |
| COFFEE | 317.25 | -5.51% | +0.67% | 335.75 | 321.20 | 313.55 | 21,747 |
| SUGAR | 16.43 | -1.79% | -3.01% | 16.73 | 17.11 | 16.22 | 171,992 |
| COCOA | 5,719 | +3.18% | -34.96% | 5,543 | 5,779 | 5,574 | 26,773 |
| ORANGE JUICE | 138.55 | -0.47% | -45.38% | 139.20 | 141.05 | 137.50 | 703 |
| COTTON | 85.03 | +2.33% | +26.78% | 83.09 | 82.90 | 81.96 | 16,546 |
| BEEF | 223.60 | -3.93% | -5.18% | 232.75 | 226.40 | 223.00 | 16,126 |
| CATTLE | 339.10 | -3.16% | -1.82% | 350.17 | 345.50 | 338.60 | 10,164 |
| USD/BRL | 5.16 | +0.01% | -5.13% | 5.16 | 5.18 | 5.14 | — |
This article was produced by The Rio Times’ automated newsroom system. How we use AI · Report an error · Editorial responsibility: Matthias Camenzind, Editor-in-Chief
LatAm Markets: Live Signals → — real-time movers, turnover leaders and FX across Latin America.