Buenos Aires leads the ranking of most expensive neighborhoods in Latin America
RIO DE JANEIRO, BRAZIL – Despite the slowdown in property sales, Buenos Aires has the neighborhood with the most expensive square meter in the region.
According to a report by Property, the trans-Andean real estate search site, Puerto Madero retains the number one position in the list of exclusive neighborhoods with an average price per square meter (m2) of US$6,002. In second and third place are Vitacura (Santiago de Chile) and Ipanema (Rio de Janeiro), with average values of US$3,800.
Read also: Check out our coverage on Argentina.
The surveyed data show that sales prices in Puerto Madero had a year-on-year increase of only 1%, while the neighborhood of the Chilean capital experienced an increase of 20%.
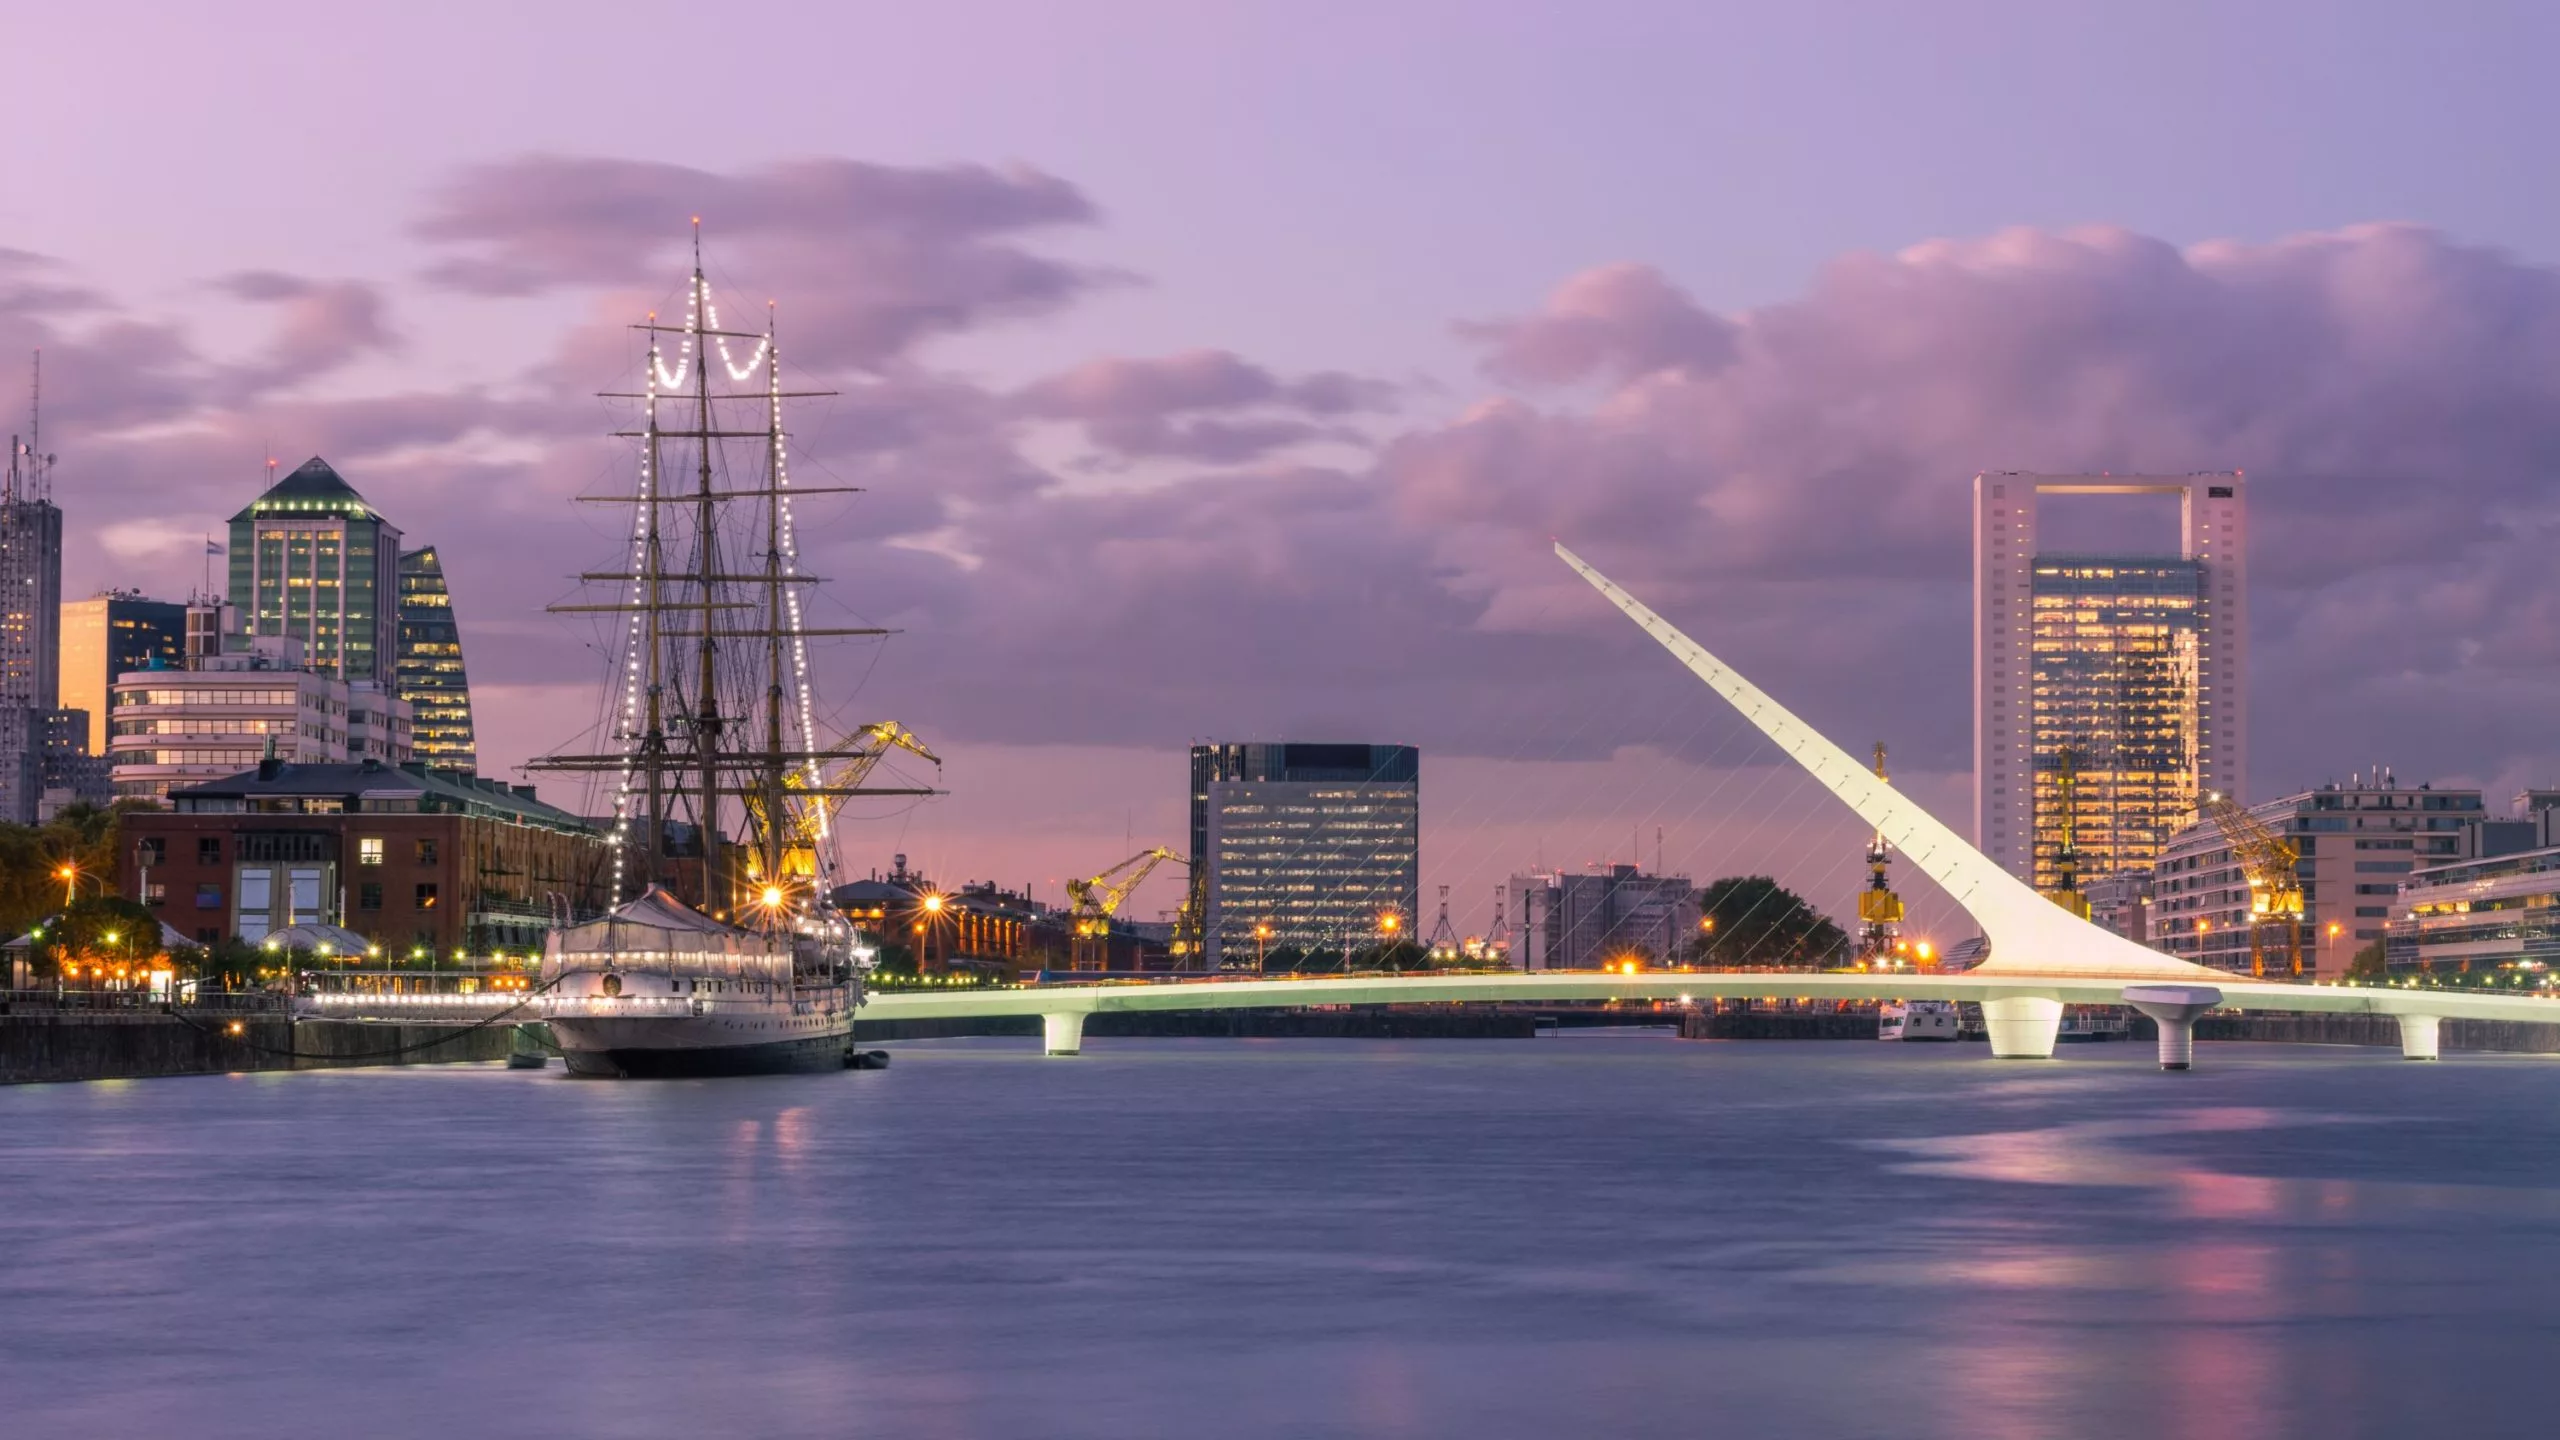
The average price in the City of Buenos Aires, according to Zonaprop data, is US$2,366 per m2, a decrease of 0.6% compared to October’s figures. Sales values accumulated a 7% drop in 2021 and 15.5% since the peak of 2019.
When closing the transaction, those drops are more considerable and reach up to 30%, according to real estate agents.
THE MOST EXPENSIVE NEIGHBORHOODS IN THE REGION
El Chicó, in Bogotá, continues to be the neighborhood with the most expensive m2 in Colombia. In Ecuador, the most expensive neighborhood is La Carolina in Quito, with an average price of US$1,598 per m2. In Peru, the San Isidro neighborhood in Lima tops the list, with an average price of US$2,415 per m2.
The report divides the neighborhoods according to social class. Those who buy a home in Ñuñoa (Santiago, Chile) pay the most to live in a middle-class area: US$3,689 per m2.
Meanwhile, Parque Batlle (Montevideo) and Caballito (Buenos Aires) complete the ranking podium with a price per square meter of around US$2,500. Castilla (Bogotá) ranks ninth, with an average price per square meter of US$1,305.
PUERTO MADERO, AN OPPORTUNITY?
According to data from Reporte Inmobiliario, the current average m2 value of a brand new apartment in Puerto Madero reached US$5,795, which represents a 10.58% drop compared to the survey conducted in December 2019.
As a reference, a 48 m2 one bedroom apartment with parking in Madero Harbour has a publication value of US$220,000, with maintenance close to 20,000 Argentine pesos (US$200) per month.
“Today, the value per square meter (m2) of an apartment for sale in the area is, on average, US$5,000. That value in March of last year, before the pandemic, was US$7,000. In other words, prices have dropped and are a real opportunity for the investor who has the cash”, explained Miranda Bosch, a firm specializing in Puerto Madero.
But, who are the investors that can bet today on the top area of the Federal Capital? “In general, they are top end clients who, today, can have access to a property in the neighborhood whereas two years ago, they could not do it,” Miranda Bosch summarizes.
More: Argentina news in English, every day from The Rio Times.
This article was produced by The Rio Times’ automated newsroom system. How we use AI · Report an error · Editorial responsibility: Matthias Camenzind, Editor-in-Chief
The Buenos Aires Guide
What The Rio Times publishes for foreigners in Buenos Aires, Argentina.
This month
Coming up in Buenos Aires
- David Bisbal Plays Buenos Aires, Argentina on 12 October 12 Oct
- Grupo Frontera Plays Buenos Aires, Argentina 13 Oct 13 Oct
- Bad Gyal brings reggaeton to Buenos Aires on 14 October 14 Oct
- Babasónicos Play Two Nights at Buenos Aires' Movistar Arena, 16 and 17 October 17 Oct
Living in Buenos Aires
- Buenos Aires Tango Festival 2027: Dates, Mundial, Guide
- Milei Peso Policy Reshapes Cost of Living Buenos Aires for Expats
- Best Buenos Aires Neighborhoods for Expats
- Argentina's Dollar Hits a 2026 High: What It Means for Your Buenos Aires Budget
Understand Argentina