Ghana Exports Surpass Imports After Two Decades of Trade Imbalances
Ghana · ECONOMY
Key Facts
—2025 exports: Ghana’s merchandise exports reached US$32.0 billion in 2025, according to the Ghana Statistical Service.
—2025 imports: Merchandise imports stood at US$20.5 billion, producing a trade surplus of GHS 148.3 billion.
—Historical shift: In 2004 exports were US$1.93 billion and imports US$4.09 billion, with imports accounting for 67.9% of total trade.
—Export share: By 2025 exports made up 61.0% of total trade, while imports fell to 39.0%.
—IMF data: Ghana’s goods trade surplus rose to 4.4% of gross domestic product in 2024, up from 2.2% in 2023.
—2026 budget: The Ministry of Finance’s 2026 budget statement called the trade balance “firmly positive.”
Ghana’s merchandise exports exceeded imports in 2025, extending a trade surplus that returned in 2023 to its widest margin in roughly two decades, driven overwhelmingly by gold earnings, according to the Ghana Statistical Service (GSS). The US$32.0 billion export figure against US$20.5 billion in imports marks a dramatic reversal from the deficit years that defined the country’s trade profile since the early 2000s.
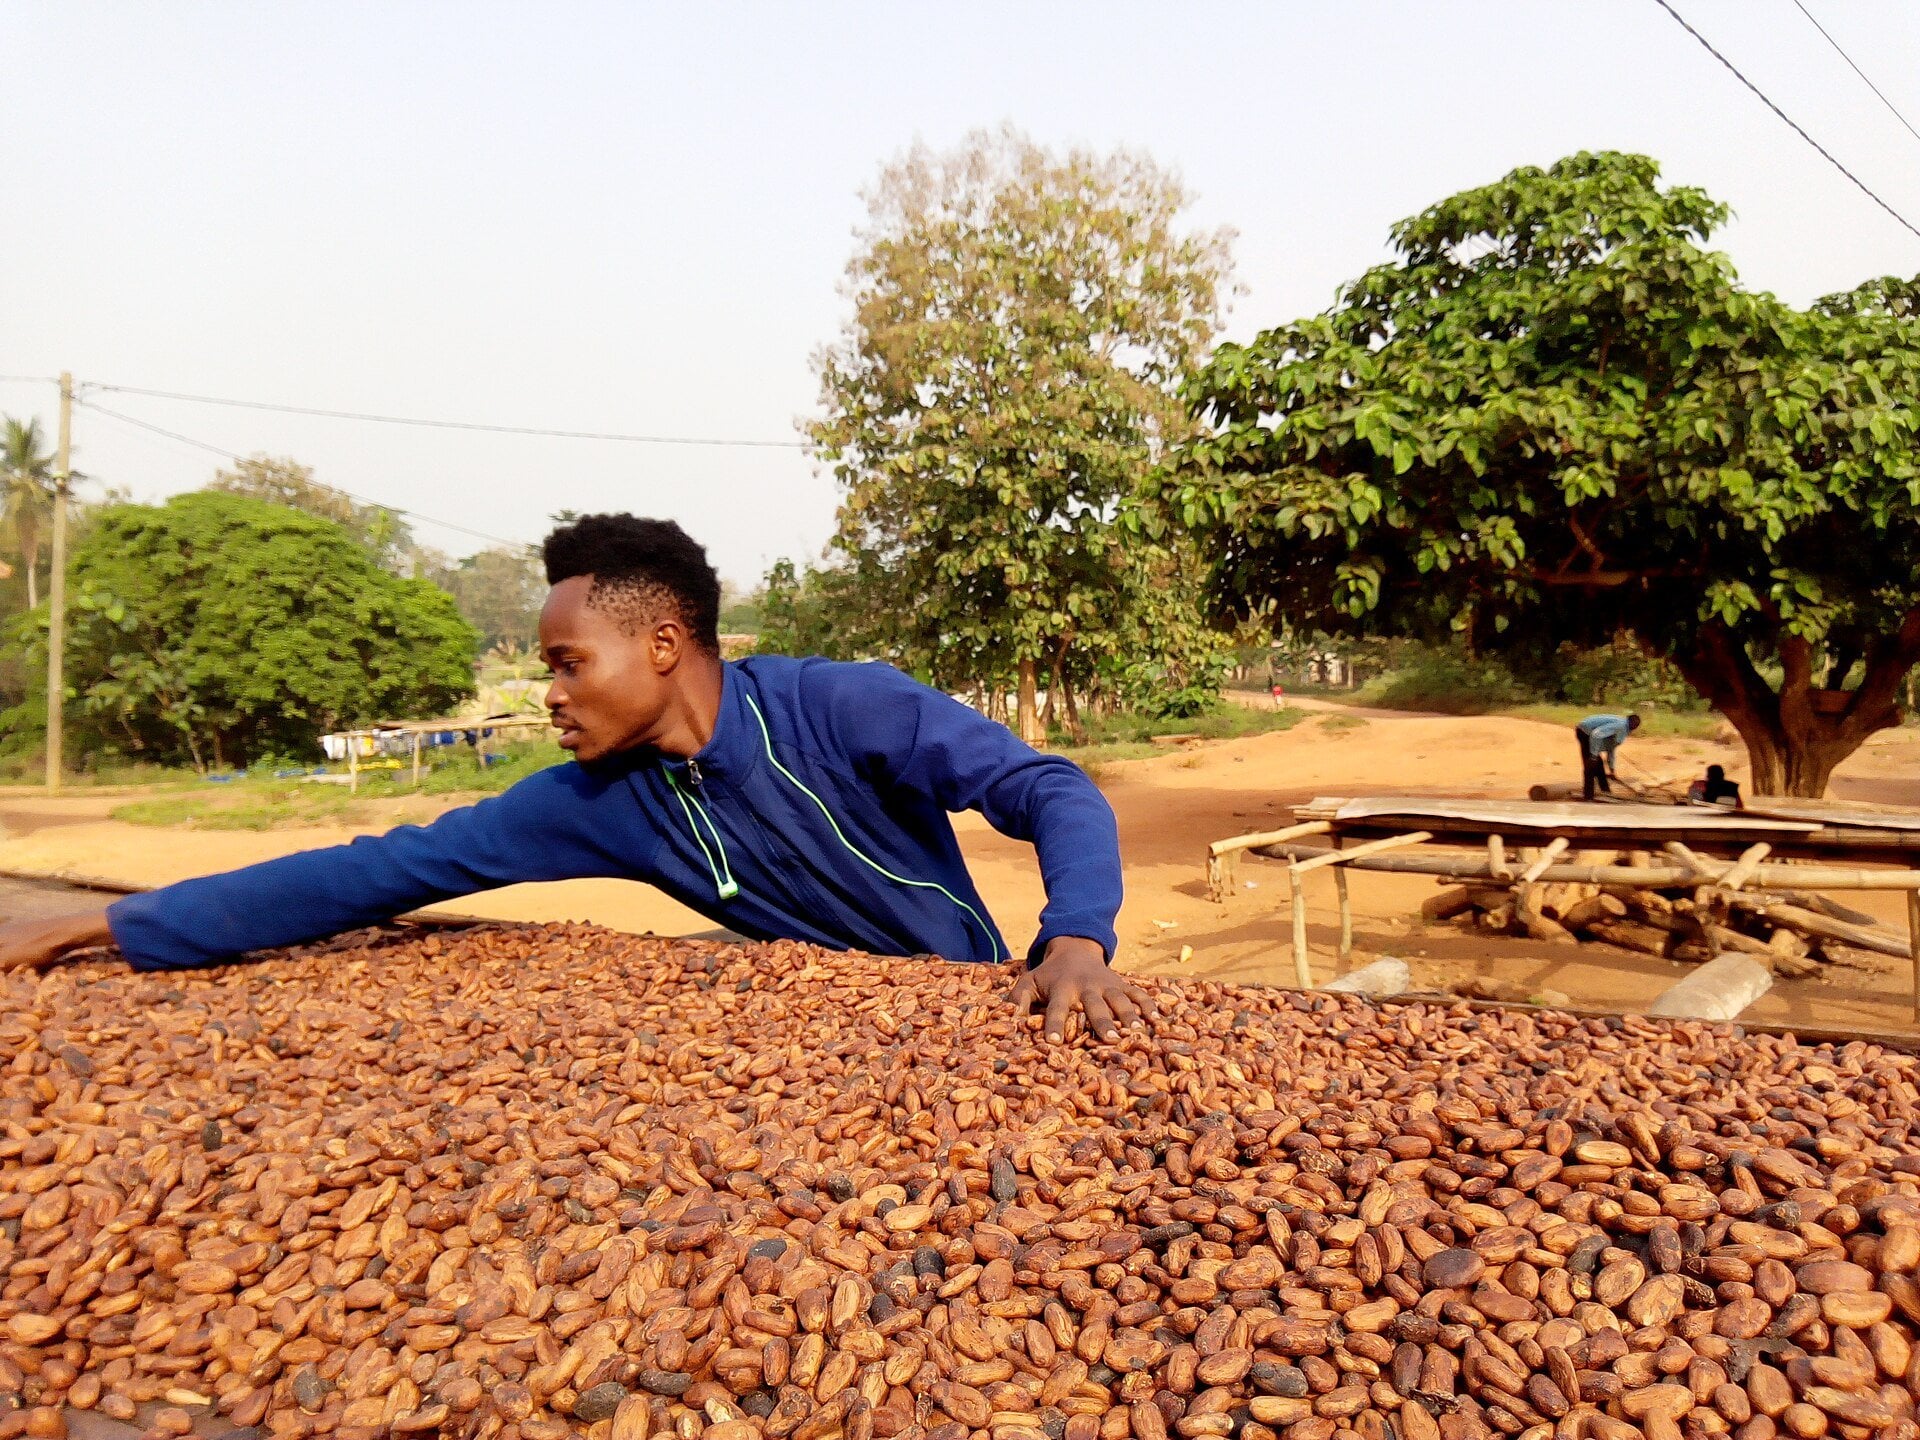
A two-decade trade turnaround
The GSS trade review shows Ghana sold more goods than it bought in only seven of the 21 years covered by the report. The country returned to a merchandise surplus in 2023 after years of persistent deficits.
In 2004, exports totalled just US$1.93 billion while imports reached US$4.09 billion. Imports then accounted for 67.9% of total trade and exports a mere 32.1%.
By 2025 that ratio had flipped. Exports made up 61.0% of total merchandise trade of US$52.5 billion, with imports at 39.0%.
Gold drives the Ghana trade surplus
Multiple official reports from 2024 to 2026 identify gold as the primary engine behind the improved external position. Cocoa recovery and petroleum also contributed, though oil sometimes weakened the picture depending on the period.
The International Monetary Fund (IMF) recorded Ghana’s goods trade surplus at 4.4% of gross domestic product (GDP) in 2024, up from 2.2% in 2023. The World Bank described the 2024 external-sector improvement as driven by a stronger trade surplus, higher remittances and foreign direct investment.
One trade analysis warns the 2025 surplus was overwhelmingly gold-driven and may be “partly cyclical rather than structurally durable.” A commodity-price windfall does not automatically mean Ghana has built a broader export manufacturing base.
What the surplus means for the cedi and reserves
Higher export receipts bring more foreign exchange inflows, which can ease pressure on the Ghanaian cedi. That reduces the urgency for emergency external support and strengthens the central bank’s ability to manage liquidity.
The Ministry of Finance’s 2026 budget statement said the trade balance remained “firmly positive.” The statement credited mining output and rising non-traditional exports.
Still, a surplus built on gold leaves Ghana exposed to global bullion price swings. Safe-haven demand and central bank reserve behaviour in major economies will continue to shape the country’s external accounts.
AfCFTA and the regional trade paradox
Ghana hosts the secretariat of the African Continental Free Trade Area (AfCFTA), giving its trade structure symbolic weight for African integration. Yet available reporting suggests Ghana has imported more under the preferential regime than it has exported.
That paradox raises questions about industrial capacity and regional value chains. A commodity-led surplus does little to answer whether Ghanaian firms can compete in manufactured goods across the continent.
The broader picture fits the pattern covered by Africa: The New Scramble, where resource-rich nations post headline trade gains while remaining dependent on primary commodity demand from China, Europe and the Gulf.
Great-power demand and commodity exposure
Ghana’s export mix still depends heavily on primary commodities rather than diversified manufacturing. That keeps the economy sensitive to demand shifts in China, European markets and Gulf states for gold, cocoa, energy inputs and shipping finance.
The sources do not quantify this great-power dependence directly, but the trade structure described in official reports supports the inference. A gold-driven surplus can reverse quickly if global prices fall or if mining output dips.
Ghana’s position as one of Africa’s major gold producers gives it macro-political leverage, but only as long as bullion markets remain favourable. The surplus is real, but its foundations are narrow.
What to watch next
The 2026 budget statement signals that policymakers expect the surplus to hold, but the GSS annual report for 2026 will be the definitive check. Sub-period figures for early 2026 already show continued surpluses, though smaller than the full-year 2025 record.
Investors should watch gold prices, cocoa output forecasts and the cedi’s performance against the dollar in the second half of 2026. Any sustained drop in commodity earnings would test whether Ghana’s trade turnaround is structural or cyclical.
The IMF and World Bank will release updated country assessments later in 2026, offering fresh data on whether the surplus is translating into broader economic resilience or remaining concentrated in a single sector.
More: Ghana news in English, every day from The Rio Times.
Frequently Asked Questions
What drove Ghana’s trade surplus in 2025?
Gold exports were the primary driver, with cocoa and petroleum also contributing, according to the Ghana Statistical Service and the Ministry of Finance.
How large was Ghana’s 2025 merchandise trade surplus?
The surplus reached GHS 148.3 billion, with exports of US$32.0 billion against imports of US$20.5 billion, the GSS reported.
Is Ghana’s trade surplus expected to last?
The 2026 budget statement called the trade balance “firmly positive,” but analysts caution the surplus is gold-driven and may be partly cyclical rather than structurally durable.
Connected Coverage
Ghana’s commodity-led surplus fits the wider pattern of resource-rich African nations navigating great-power demand, a theme explored in Africa: The New Scramble.
Sources
This article was produced by The Rio Times’ automated newsroom system. How we use AI · Report an error
Read More from The Rio Times