IBOV 166,934.20 ▼ 0.10% IPSA 11,042.67 ▲ 0.39% IPC MEX 64,397.45 ▼ 0.66% MERVAL 2,947,349 ▼ 1.77% COLCAP 2,452.46 ▲ 0.84% BVL PERÚ 58,104.31 ▲ 0.40% USD/BRL5.22▼ 0.05% USD/MXN17.00▼ 0.15% USD/CLP914.45▼ 0.02% USD/COP3,131▼ 0.07% USD/PEN3.36▼ 0.23% USD/ARS1,488▼ 0.02% USD/UYU40.33— 0.00% USD/PYG5,984— 0.00% USD/BOB11.54— 0.00% USD/DOP58.31▼ 0.24% USD/CRC446.12— 0.00% USD/GTQ7.62— 0.00% USD/HNL26.79— 0.00% USD/NIO36.62— 0.00% USD/VES770.61▼ 0.13% USD/PAB1.00— 0.00% USD/BZD2.00— 0.00% USD/JMD 157.28 — 0.00% USD/TTD6.70— 0.00% EUR/BRL6.05▲ 0.12% BRENT 88.88 ▼ 0.03% WTI 83.11 ▼ 0.11% IRON ORE 161.91 — — COPPER 6.61 ▲ 0.03% GOLD 4,461 ▲ 1.78% SILVER 65.59 ▲ 1.26% SOY 1,184 ▲ 3.20% CORN 480.50 ▲ 10.02% WHEAT 655.00 ▲ 3.93% COFFEE 317.25 ▼ 5.51% SUGAR 16.43 ▼ 1.79% ORANGE JUICE 138.55 ▼ 0.47% COTTON 85.03 ▲ 2.33% COCOA 5,719 ▲ 3.18% BEEF 223.60 ▼ 3.93% CATTLE 339.10 ▼ 3.16% LITHIUM 75.20 ▲ 1.47% PETR4 41.64 ▼ 0.05% VALE3 72.97 ▲ 0.83% ITUB4 38.60 ▼ 1.03% BBDC4 16.85 ▲ 0.36% ABEV3 14.89 ▼ 0.80% BBAS3 19.37 ▲ 0.47% B3SA3 14.26 ▼ 0.21% WEGE3 47.59 ▲ 0.49% PRIO3 59.14 ▼ 0.19% SUZB3 41.33 ▲ 2.35% RENT3 34.68 ▼ 0.09% AZZA3 15.89 ▼ 2.63% CSAN3 3.22 ▼ 1.83% RAIZ4 0.25 — 0.00% PCAR3 2.75 ▼ 0.36% GMAT3 3.65 ▼ 1.08% PSSA3 48.13 ▼ 0.54% CVCB3 1.33 ▼ 2.92% POSI3 3.36 ▲ 2.44% SLCE3 13.34 ▲ 0.30% NATU3 8.14 ▼ 0.73% IBOV 166,934.20 ▼ 0.10% IPSA 11,042.67 ▲ 0.39% IPC MEX 64,397.45 ▼ 0.66% MERVAL 2,947,349 ▼ 1.77% COLCAP 2,452.46 ▲ 0.84% BVL PERÚ 58,104.31 ▲ 0.40% USD/BRL 5.16 ▲ 0.01% USD/MXN 17.06 ▼ 0.24% USD/CLP 913.98 ▲ 0.04% USD/COP 3,140 ▲ 0.03% USD/PEN 3.36 ▼ 0.66% USD/ARS 1,493 ▲ 0.10% USD/UYU 40.27 ▲ 1.24% USD/PYG 5,939 ▲ 1.68% USD/BOB 11.64 ▼ 0.76% USD/DOP 58.34 ▲ 1.25% USD/CRC 445.92 ▲ 0.89% USD/GTQ 7.62 ▲ 2.21% USD/HNL 26.79 ▲ 1.57% USD/NIO 36.62 ▲ 0.69% USD/VES 762.44 ▼ 0.13% USD/PAB 1.00 — 0.00% USD/BZD 2.00 — 0.00% USD/JMD 157.28 — 0.00% USD/TTD 6.70 ▲ 0.61% EUR/BRL 5.95 ▲ 1.01% BRENT 88.88 ▼ 0.03% WTI 83.11 ▼ 0.11% IRON ORE 161.91 — — COPPER 6.61 ▲ 0.03% GOLD 4,461 ▲ 1.78% SILVER 65.59 ▲ 1.26% SOY 1,184 ▲ 3.20% CORN 480.50 ▲ 10.02% WHEAT 655.00 ▲ 3.93% COFFEE 317.25 ▼ 5.51% SUGAR 16.43 ▼ 1.79% ORANGE JUICE 138.55 ▼ 0.47% COTTON 85.03 ▲ 2.33% COCOA 5,719 ▲ 3.18% BEEF 223.60 ▼ 3.93% CATTLE 339.10 ▼ 3.16% LITHIUM 75.20 ▲ 1.47% PETR4 41.64 ▼ 0.05% VALE3 72.97 ▲ 0.83% ITUB4 38.60 ▼ 1.03% BBDC4 16.85 ▲ 0.36% ABEV3 14.89 ▼ 0.80% BBAS3 19.37 ▲ 0.47% B3SA3 14.26 ▼ 0.21% WEGE3 47.59 ▲ 0.49% PRIO3 59.14 ▼ 0.19% SUZB3 41.33 ▲ 2.35% RENT3 34.68 ▼ 0.09% AZZA3 15.89 ▼ 2.63% CSAN3 3.22 ▼ 1.83% RAIZ4 0.25 — 0.00% PCAR3 2.75 ▼ 0.36% GMAT3 3.65 ▼ 1.08% PSSA3 48.13 ▼ 0.54% CVCB3 1.33 ▼ 2.92% POSI3 3.36 ▲ 2.44% SLCE3 13.34 ▲ 0.30% NATU3 8.14 ▼ 0.73%
since 2009
Monday, August 17, 2026

Brazil Business - Brazil

Brazil’s Property Prices Outpace Inflation for the Fourth Year

By · June 3, 2025 · 2 min read

Daily Brief

The morning intel from across Latin America. Free.

By subscribing you agree to our privacy policy. We never share your email.

Brazil’s residential property market recorded its strongest price surge in over a decade, with official data from the FipeZAP Index showing a 7.73% rise in 2024. This growth outpaced consumer inflation, which stood at 4.64%.

The price increase marks the highest since 2013 and reflects a market shaped by robust demand, government incentives, and limited supply. However, the rapid rise in property values has brought significant affordability challenges for many Brazilians.

The market’s expansion is not uniform across the country. Cities such as Curitiba, Salvador, and João Pessoa saw price jumps of 18%, 16.38%, and 15.54%, respectively.

Other major cities like São Paulo and Rio de Janeiro experienced more moderate gains, with increases of 6.11% and 4.62%. The average price per square meter reached R$ 9,366 nationwide, but in some cities, like Vitória, prices exceeded R$ 13,000 per square meter.

This surge in property prices coincided with record levels of new housing launches and sales. In 2024, developers launched 383,483 units, an 18.6% increase over the previous year, while sales rose by 20.9% to 400,547 units.
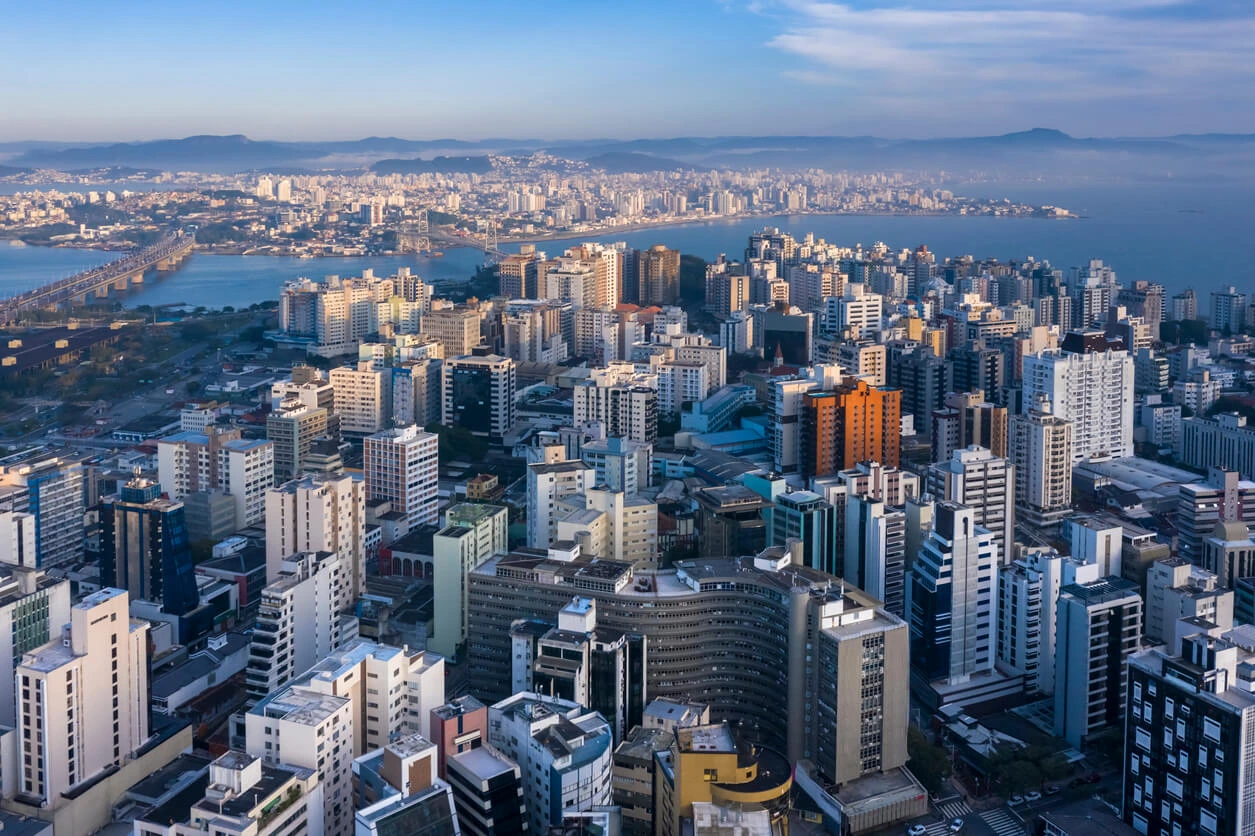
Brazil’s Property Prices Outpace Inflation for the Fourth Year
Brazil’s Property Prices Outpace Inflation for the Fourth Year. (Photo Internet reproduction)
One-stop reference
Company Intelligence
Every listed company in Latin America — financials, ownership and structure for 1,450+ companies across 26 exchanges, in one place.
Browse the directory →
RT
Ask Rio Times
Latin American markets, currencies and companies.
Open the full Ask Rio Times →

These figures, reported by the Brazilian Chamber of Construction Industry, represent the highest ever recorded. The increased activity reduced available inventory, with the stock of properties dropping by 7.8% to 291,928 units.

Several factors drove this growth. Brazil’s central bank lowered its benchmark Selic rate to around 9% by late 2024, making mortgages more accessible.

Government programs, especially “Minha Casa, Minha Vida,” played a key role by subsidizing loans for lower-income buyers and accounting for over half of all sales and launches.

At the same time, urbanization and a growing middle class fueled demand for modern, well-located homes. However, the market’s momentum has created new obstacles.

Construction costs doubled over the past decade, reaching R$ 2,129 per square meter in 2024. Labor remains the main contributor to these costs.

Banks, facing higher funding costs and tighter regulations, have begun restricting credit, particularly for middle-class buyers who do not qualify for subsidy programs.

Caixa Econômica Federal, which handles 70% of housing loans, now limits financing to properties below R$ 1.5 million and requires higher down payments.

Rental prices also climbed sharply, rising 13.5% in 2024—well above inflation. In some cities, such as Salvador, rents soared by over 33%. This trend highlights a growing gap between property values, wages, and rental affordability.

The real story behind Brazil’s property boom is a market that remains attractive for investors and developers, but increasingly difficult for ordinary families.

Without effective solutions to rising costs and limited credit, the risk of exclusion from homeownership grows, raising questions about the long-term sustainability of current trends.

This article was drafted with automated assistance and reviewed before publication. How we use AI · Report an error

Read More from The Rio Times

The Rio Times · Power Map
See who really holds power in Latin America
Click to open the Power Map

Rotate for Best Experience

This report is optimized for landscape viewing. Rotate your phone for the full experience.