IBOV 174,586.26 ▲ 0.01% IPSA 11,367.47 ▼ 0.73% IPC MEX 66,644.91 ▲ 0.53% MERVAL 3,019,891 ▲ 0.36% COLCAP 2,493.32 ▼ 0.60% BVL PERÚ 60,449.35 ▲ 0.24% USD/BRL5.15▼ 0.01% USD/MXN16.95▼ 0.02% USD/CLP921.00▲ 0.84% USD/COP3,127▲ 2.08% USD/PEN3.34▼ 0.37% USD/ARS1,514▲ 0.12% USD/UYU40.18▲ 1.55% USD/PYG5,957▲ 0.99% USD/BOB11.50▲ 1.47% USD/DOP58.15▼ 0.27% USD/CRC450.21▲ 2.07% USD/GTQ7.62▲ 2.21% USD/HNL26.82▲ 0.34% USD/NIO36.62▲ 0.09% USD/VES785.55▼ 0.13% USD/PAB1.00— 0.00% USD/BZD2.00— 0.00% USD/JMD 157.28 — 0.00% USD/TTD6.73▲ 1.10% EUR/BRL6.00▼ 0.14% BRENT 88.88 ▼ 0.03% WTI 83.11 ▼ 0.11% IRON ORE 161.91 — — COPPER 6.61 ▲ 0.03% GOLD 4,461 ▲ 1.78% SILVER 65.59 ▲ 1.26% SOY 1,184 ▲ 3.20% CORN 480.50 ▲ 10.02% WHEAT 655.00 ▲ 3.93% COFFEE 317.25 ▼ 5.51% SUGAR 16.43 ▼ 1.79% ORANGE JUICE 138.55 ▼ 0.47% COTTON 85.03 ▲ 2.33% COCOA 5,719 ▲ 3.18% BEEF 223.60 ▼ 3.93% CATTLE 339.10 ▼ 3.16% LITHIUM 75.20 ▲ 1.47% PETR4 41.64 ▼ 0.05% VALE3 72.97 ▲ 0.83% ITUB4 38.60 ▼ 1.03% BBDC4 16.85 ▲ 0.36% ABEV3 14.89 ▼ 0.80% BBAS3 19.37 ▲ 0.47% B3SA3 14.26 ▼ 0.21% WEGE3 47.59 ▲ 0.49% PRIO3 59.14 ▼ 0.19% SUZB3 41.33 ▲ 2.35% RENT3 34.68 ▼ 0.09% AZZA3 15.89 ▼ 2.63% CSAN3 3.22 ▼ 1.83% RAIZ4 0.25 — 0.00% PCAR3 2.75 ▼ 0.36% GMAT3 3.65 ▼ 1.08% PSSA3 48.13 ▼ 0.54% CVCB3 1.33 ▼ 2.92% POSI3 3.36 ▲ 2.44% SLCE3 13.34 ▲ 0.30% NATU3 8.14 ▼ 0.73% IBOV 174,586.26 ▲ 0.01% IPSA 11,367.47 ▼ 0.73% IPC MEX 66,644.91 ▲ 0.53% MERVAL 3,019,891 ▲ 0.36% COLCAP 2,493.32 ▼ 0.60% BVL PERÚ 60,449.35 ▲ 0.24% USD/BRL 5.16 ▲ 0.01% USD/MXN 17.06 ▼ 0.24% USD/CLP 913.98 ▲ 0.04% USD/COP 3,140 ▲ 0.03% USD/PEN 3.36 ▼ 0.66% USD/ARS 1,493 ▲ 0.10% USD/UYU 40.27 ▲ 1.24% USD/PYG 5,939 ▲ 1.68% USD/BOB 11.64 ▼ 0.76% USD/DOP 58.34 ▲ 1.25% USD/CRC 445.92 ▲ 0.89% USD/GTQ 7.62 ▲ 2.21% USD/HNL 26.79 ▲ 1.57% USD/NIO 36.62 ▲ 0.69% USD/VES 762.44 ▼ 0.13% USD/PAB 1.00 — 0.00% USD/BZD 2.00 — 0.00% USD/JMD 157.28 — 0.00% USD/TTD 6.70 ▲ 0.61% EUR/BRL 5.95 ▲ 1.01% BRENT 88.88 ▼ 0.03% WTI 83.11 ▼ 0.11% IRON ORE 161.91 — — COPPER 6.61 ▲ 0.03% GOLD 4,461 ▲ 1.78% SILVER 65.59 ▲ 1.26% SOY 1,184 ▲ 3.20% CORN 480.50 ▲ 10.02% WHEAT 655.00 ▲ 3.93% COFFEE 317.25 ▼ 5.51% SUGAR 16.43 ▼ 1.79% ORANGE JUICE 138.55 ▼ 0.47% COTTON 85.03 ▲ 2.33% COCOA 5,719 ▲ 3.18% BEEF 223.60 ▼ 3.93% CATTLE 339.10 ▼ 3.16% LITHIUM 75.20 ▲ 1.47% PETR4 41.64 ▼ 0.05% VALE3 72.97 ▲ 0.83% ITUB4 38.60 ▼ 1.03% BBDC4 16.85 ▲ 0.36% ABEV3 14.89 ▼ 0.80% BBAS3 19.37 ▲ 0.47% B3SA3 14.26 ▼ 0.21% WEGE3 47.59 ▲ 0.49% PRIO3 59.14 ▼ 0.19% SUZB3 41.33 ▲ 2.35% RENT3 34.68 ▼ 0.09% AZZA3 15.89 ▼ 2.63% CSAN3 3.22 ▼ 1.83% RAIZ4 0.25 — 0.00% PCAR3 2.75 ▼ 0.36% GMAT3 3.65 ▼ 1.08% PSSA3 48.13 ▼ 0.54% CVCB3 1.33 ▼ 2.92% POSI3 3.36 ▲ 2.44% SLCE3 13.34 ▲ 0.30% NATU3 8.14 ▼ 0.73%
since 2009
Wednesday, August 26, 2026

Brazil Business - Brazil

In the last decade, average income from coffee plantations grew 38% in Brazil, says study

By · January 17, 2023 · 2 min read

Daily Brief

The morning intel from across Latin America. Free.

By subscribing you agree to our privacy policy. We never share your email.

In the period between 2018 and 2021, Brazilian coffee plantations yielded, on average, R$21,700 (US$4,220) per hectare, which represented a growth of 38% compared to the average performance of the period between 2008 and 2011, when “productivity in value per hectare” was R$16,800 (US$3,270).

The finding appears in the study “Coffee Agribusiness – Production, Transformation and Opportunities”, by the Federation of Industries of the State of São Paulo (Fiesp).

In the same comparison, agricultural productivity increased by 42.5% in Brazil, from 21.1 to 30 bags of coffee per hectare. The planted area, in turn, decreased by 12.3%, to 1.8 million hectares.
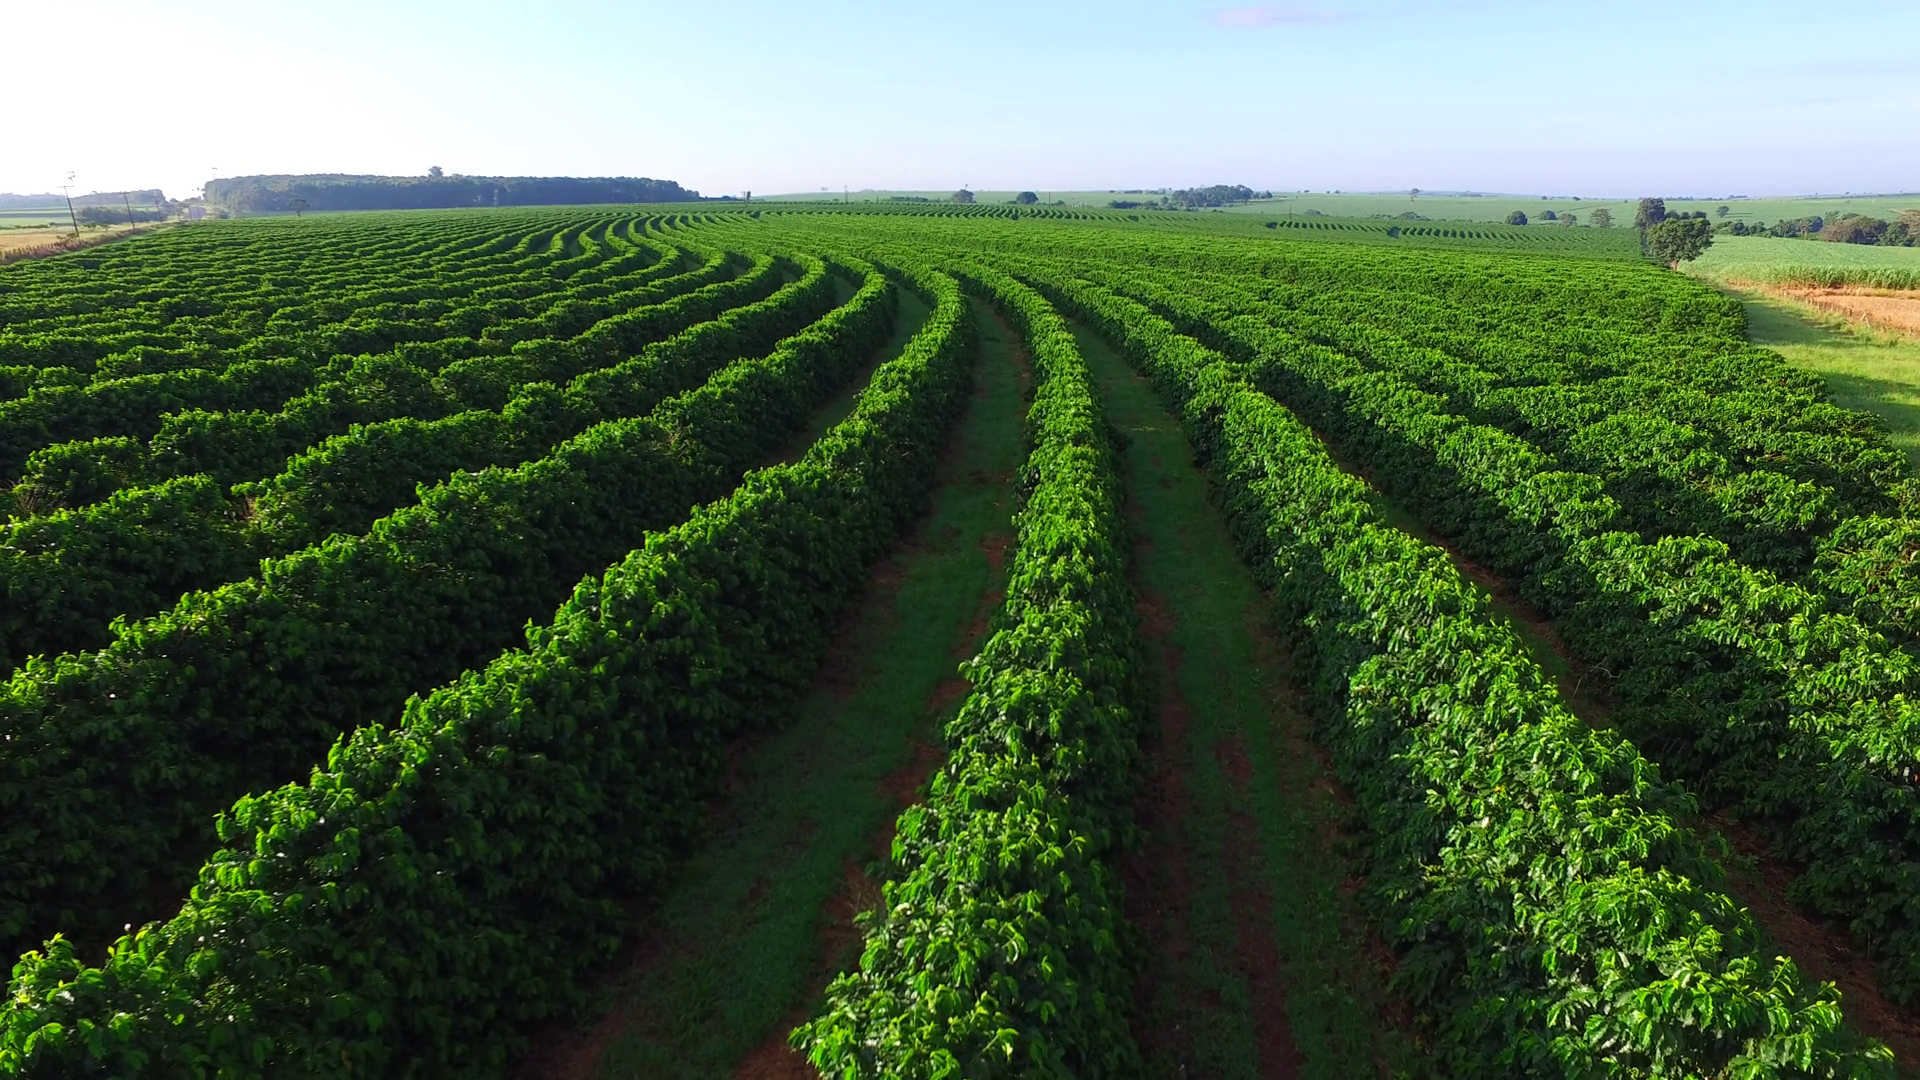
According to the study, the number of coffee trees planted grew by 12.1%, totaling 7.1 million plants (Photo internet reproduction)
One-stop reference
Company Intelligence
Every listed company in Latin America — financials, ownership and structure for 1,450+ companies across 26 exchanges, in one place.
Browse the directory →
RT
Ask Rio Times
Latin American markets, currencies and companies.
Open the full Ask Rio Times →

“Despite the reduction in the planted area, the sector invested in technology and gained efficiency by increasing the number of trees planted and the density of trees in production, providing an increase in the volume of the harvest”, said Fiesp, in a statement.

According to the study, the number of coffee trees planted grew by 12.1%, totaling 7.1 million plants.

The average volume of coffee available for processing and consumption rose 13% to 21.2 million bags.

Per capita consumption in Brazil has remained stagnant – the average in the two intervals was 6 kilos per inhabitant per year.

The number of countries that import Brazilian coffee has grown over the last decade, going from 134 to 149.

Revenue from shipments, on the other hand, fell by 27%.

Sales to the foreign market had an unusual performance in 2011, when sales reached US$8.8 billion. Since then, the total value of exports has fluctuated between US$5.1 billion and US$6.6 billion per year.

The Gross Production Value (GPV) of crops grew 13% in the comparison between the two intervals, to R$39.8 billion US$7.74 billion).

Production increased by 25.3%. In the average of the 2008/2009 to 2011/2012 harvests, production was 44.3 million 60-kilogram bags; between the 2018/2019 and 2021/2022 cycles, the average was 55.4 million, according to the National Supply Company (Conab).

“These numbers suggest an evolution in production factors, with genetic improvement, good agricultural practices and good infrastructure on the properties. Investments in machinery, equipment and agricultural implements made it possible to increase productivity, production and value generated”, emphasizes the Fiesp study.

With information from Valor Econômico

Read More from The Rio Times

The Rio Times · Power Map
See who really holds power in Latin America
Click to open the Power Map

Rotate for Best Experience

This report is optimized for landscape viewing. Rotate your phone for the full experience.