IBOV 185,992.03 ▲ 0.24% IPSA 11,381.18 ▲ 1.30% IPC MEX 63,684.18 ▲ 0.28% MERVAL 3,061,512 ▲ 1.08% COLCAP 2,521.85 ▲ 0.40% BVL PERÚ 58,965.05 ▲ 1.80% USD/BRL5.12▼ 0.57% USD/MXN17.16▼ 0.51% USD/CLP960.65▲ 0.54% USD/COP3,154▲ 1.02% USD/PEN3.37▲ 0.43% USD/ARS1,510▼ 0.21% USD/UYU40.20▲ 3.11% USD/PYG5,888▲ 2.09% USD/BOB9.75▼ 12.91% USD/DOP58.97▲ 0.20% USD/CRC444.45▲ 2.53% USD/GTQ7.63▲ 3.11% USD/HNL26.85▲ 3.22% USD/NIO36.62▲ 2.69% USD/VES845.33▼ 0.13% USD/PAB1.00— 0.00% USD/BZD2.00— 0.00% USD/JMD 157.28 — 0.00% USD/TTD6.74▲ 2.56% EUR/BRL5.88▼ 0.79% BRENT 88.88 ▼ 0.03% WTI 83.11 ▼ 0.11% IRON ORE 161.91 — — COPPER 6.61 ▲ 0.03% GOLD 4,461 ▲ 1.78% SILVER 65.59 ▲ 1.26% SOY 1,184 ▲ 3.20% CORN 480.50 ▲ 10.02% WHEAT 655.00 ▲ 3.93% COFFEE 317.25 ▼ 5.51% SUGAR 16.43 ▼ 1.79% ORANGE JUICE 138.55 ▼ 0.47% COTTON 85.03 ▲ 2.33% COCOA 5,719 ▲ 3.18% BEEF 223.60 ▼ 3.93% CATTLE 339.10 ▼ 3.16% LITHIUM 75.20 ▲ 1.47% PETR4 41.64 ▼ 0.05% VALE3 72.97 ▲ 0.83% ITUB4 38.60 ▼ 1.03% BBDC4 16.85 ▲ 0.36% ABEV3 14.89 ▼ 0.80% BBAS3 19.37 ▲ 0.47% B3SA3 14.26 ▼ 0.21% WEGE3 47.59 ▲ 0.49% PRIO3 59.14 ▼ 0.19% SUZB3 41.33 ▲ 2.35% RENT3 34.68 ▼ 0.09% AZZA3 15.89 ▼ 2.63% CSAN3 3.22 ▼ 1.83% RAIZ4 0.25 — 0.00% PCAR3 2.75 ▼ 0.36% GMAT3 3.65 ▼ 1.08% PSSA3 48.13 ▼ 0.54% CVCB3 1.33 ▼ 2.92% POSI3 3.36 ▲ 2.44% SLCE3 13.34 ▲ 0.30% NATU3 8.14 ▼ 0.73% IBOV 185,992.03 ▲ 0.24% IPSA 11,381.18 ▲ 1.30% IPC MEX 63,684.18 ▲ 0.28% MERVAL 3,061,512 ▲ 1.08% COLCAP 2,521.85 ▲ 0.40% BVL PERÚ 58,965.05 ▲ 1.80% USD/BRL 5.16 ▲ 0.01% USD/MXN 17.06 ▼ 0.24% USD/CLP 913.98 ▲ 0.04% USD/COP 3,140 ▲ 0.03% USD/PEN 3.36 ▼ 0.66% USD/ARS 1,493 ▲ 0.10% USD/UYU 40.27 ▲ 1.24% USD/PYG 5,939 ▲ 1.68% USD/BOB 11.64 ▼ 0.76% USD/DOP 58.34 ▲ 1.25% USD/CRC 445.92 ▲ 0.89% USD/GTQ 7.62 ▲ 2.21% USD/HNL 26.79 ▲ 1.57% USD/NIO 36.62 ▲ 0.69% USD/VES 762.44 ▼ 0.13% USD/PAB 1.00 — 0.00% USD/BZD 2.00 — 0.00% USD/JMD 157.28 — 0.00% USD/TTD 6.70 ▲ 0.61% EUR/BRL 5.95 ▲ 1.01% BRENT 88.88 ▼ 0.03% WTI 83.11 ▼ 0.11% IRON ORE 161.91 — — COPPER 6.61 ▲ 0.03% GOLD 4,461 ▲ 1.78% SILVER 65.59 ▲ 1.26% SOY 1,184 ▲ 3.20% CORN 480.50 ▲ 10.02% WHEAT 655.00 ▲ 3.93% COFFEE 317.25 ▼ 5.51% SUGAR 16.43 ▼ 1.79% ORANGE JUICE 138.55 ▼ 0.47% COTTON 85.03 ▲ 2.33% COCOA 5,719 ▲ 3.18% BEEF 223.60 ▼ 3.93% CATTLE 339.10 ▼ 3.16% LITHIUM 75.20 ▲ 1.47% PETR4 41.64 ▼ 0.05% VALE3 72.97 ▲ 0.83% ITUB4 38.60 ▼ 1.03% BBDC4 16.85 ▲ 0.36% ABEV3 14.89 ▼ 0.80% BBAS3 19.37 ▲ 0.47% B3SA3 14.26 ▼ 0.21% WEGE3 47.59 ▲ 0.49% PRIO3 59.14 ▼ 0.19% SUZB3 41.33 ▲ 2.35% RENT3 34.68 ▼ 0.09% AZZA3 15.89 ▼ 2.63% CSAN3 3.22 ▼ 1.83% RAIZ4 0.25 — 0.00% PCAR3 2.75 ▼ 0.36% GMAT3 3.65 ▼ 1.08% PSSA3 48.13 ▼ 0.54% CVCB3 1.33 ▼ 2.92% POSI3 3.36 ▲ 2.44% SLCE3 13.34 ▲ 0.30% NATU3 8.14 ▼ 0.73%
since 2009
Friday, September 18, 2026

Unexpected Drop in U.S. Crude Stocks Rattles Oil Markets

By · July 17, 2024 · 2 min read

The LatAm Brief

One email, every weekday morning. What moved in Latin American markets, politics and expat life.

Yesterday’s subject line: “The Fed raised. Brazil cut, four hours later.”

Free. We send a confirmation link first — nothing arrives until you click it. Unsubscribe with one click in any edition. If you stop opening us for 30 days we stop sending by ourselves, as we assume the interest is no longer there. See our privacy policy. We never share your email.

Last week, U.S. crude oil inventories plunged unexpectedly, catching market analysts off guard.

The Department of Energy reported a significant 4.9 million barrel decline for the week ending July 12. Analysts had anticipated a 1 million barrel increase.

This marked shift sent the total crude inventories down to 440.2 million barrels—5% below the five-year average for this season.

The stark drop in crude reserves is critical. It influences everything from gasoline prices at the pump to international oil markets.

Investors watch these numbers closely as they can signal changes in oil production or consumption patterns.

Despite the fall in crude stocks, other petroleum products told a different story. Motor gasoline inventories rose by 3.3 million barrels, slightly above the seasonal norm.
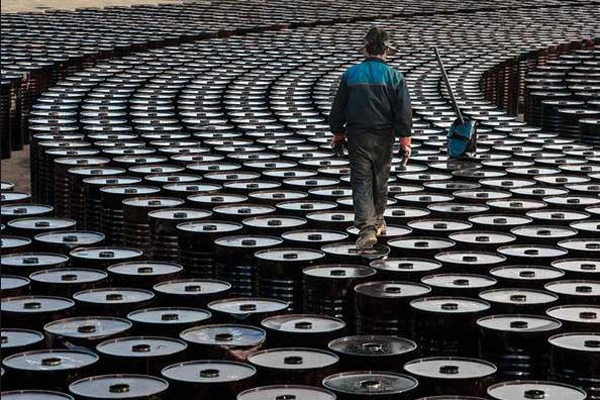
Unexpected Drop in U.S. Crude Stocks Rattles Oil Markets.
One-stop reference
Company Intelligence
Every listed company in Latin America — financials, ownership and structure for 1,450+ companies across 26 exchanges, in one place.
Browse the directory →
RT
Ask Rio Times
Latin American markets, currencies and companies.
Open the full Ask Rio Times →

This contrast highlights the complexity of oil market dynamics, where different products can diverge based on refining rates and demand.

Speaking of refining, U.S. refineries were bustling, operating at 93.7% capacity. This high activity rate helps explain the rise in gasoline and distillate stocks.

Distillate fuels, including diesel and heating oil, also saw an increase—up by 3.5 million barrels.

However, they remain 7% below their five-year average, indicating a tightness in supply that could impact heating costs and trucking rates.

Unexpected Drop in U.S. Crude Stocks Rattles Oil Markets

On the import front, the U.S. saw a surge in crude oil imports to an average of 7.0 million barrels per day, up by 277,000 barrels from the previous week.

This increase is a response to the tight domestic stocks and a testament to the global interconnectedness of oil markets.

These fluctuations in oil inventories and refinery outputs are more than mere statistics. They affect global economies, influence environmental policies, and can sway the cost of goods and travel.

Investment expert Clara Sodré suggests that understanding these trends is key, even for novice investors aiming for long-term gains.

The volatile dance of supply and demand in oil markets continues to challenge and intrigue those who keep a watchful eye on energy developments.

This article was produced by The Rio Times’ automated newsroom system. How we use AI · Report an error

LatAm Markets: Live Signals → — real-time movers, turnover leaders and FX across Latin America.

Read More from The Rio Times

The Rio Times · Power Map
See who really holds power in Latin America
Click to open the Power Map

Rotate for Best Experience

This report is optimized for landscape viewing. Rotate your phone for the full experience.