Key Facts
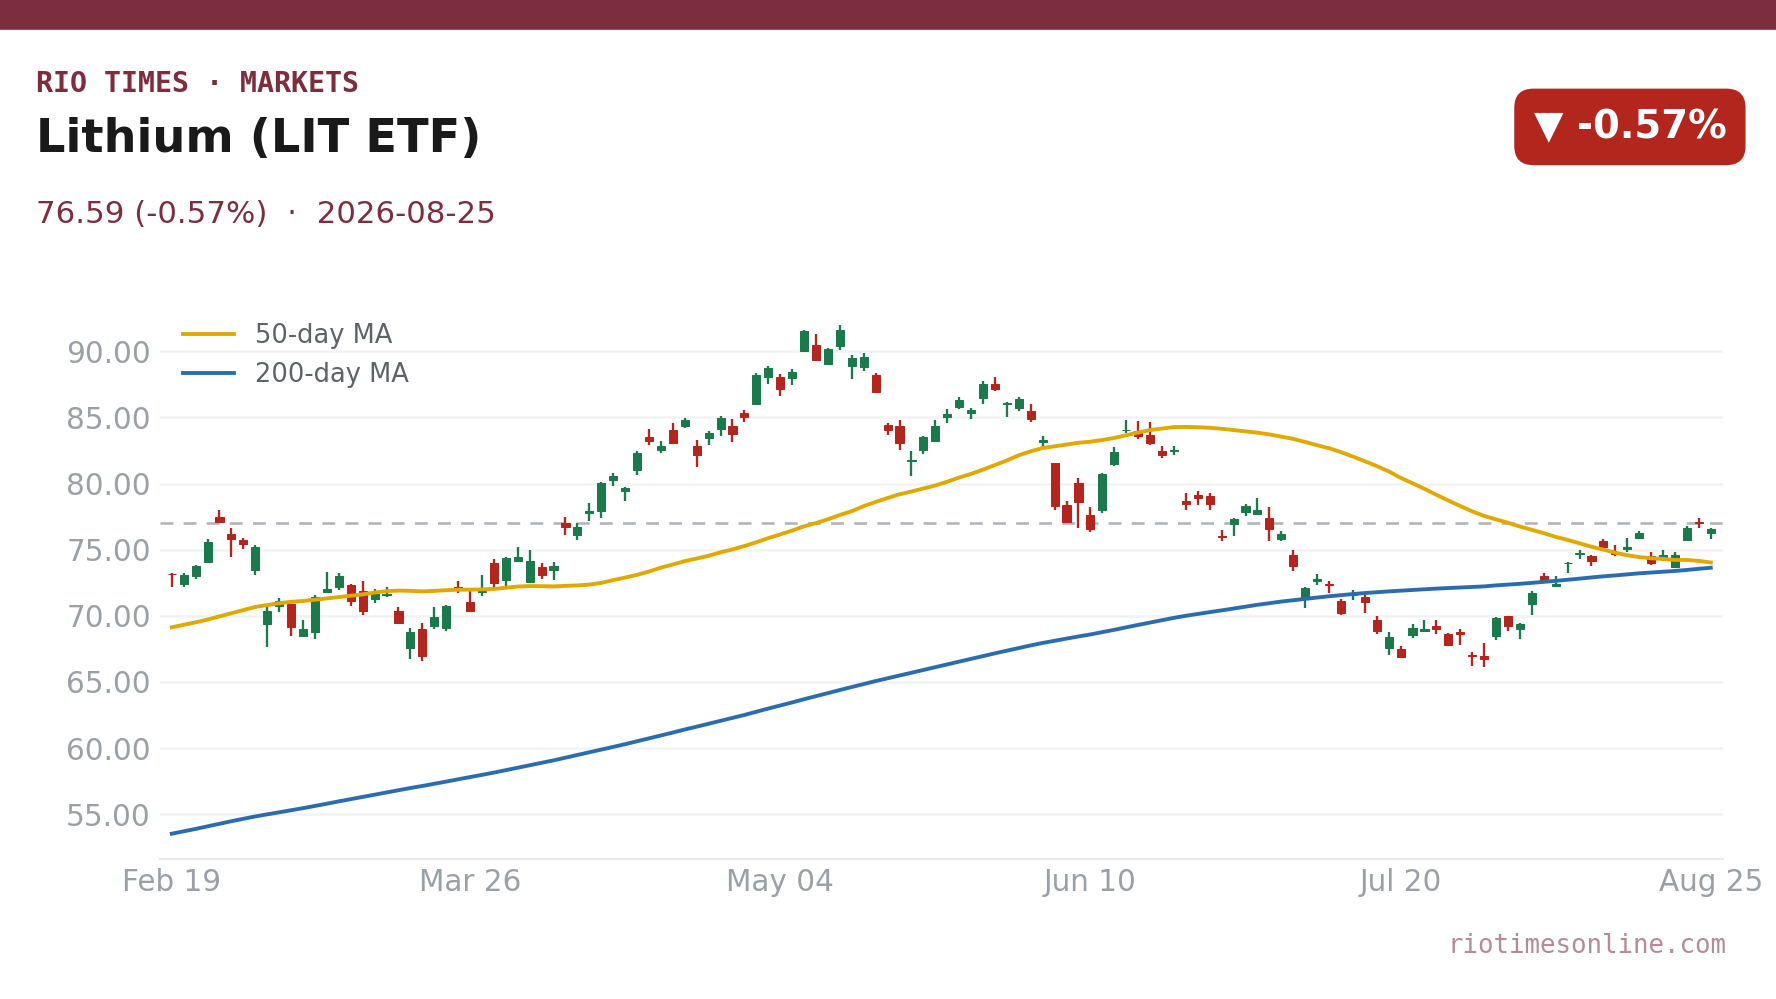
- LIT ETF fell the lithium-miners fund closed at US$76.59, down 0.57% on Tuesday, August 25, 2026.
- Albemarle dropped hardest the US lithium major ended at US$133.18, down 5.89%, leading the board lower.
- SQM also gave ground the Chilean brine producer closed at US$79.21, down 3.79% on the session.
- Chinese futures reversed Guangzhou Futures Exchange LC2609 closed at 149,300 CNY per tonne after trading as high as 157,980 CNY.
- Spot carbonate sagged SMM Battery-Grade Lithium Carbonate Index averaged 20,615 USD per tonne, down 398.76 USD on the day.
- Sellers held back SMM reported Chinese lithium chemical plants were reluctant to offer spot material despite the day’s futures and index declines.
Today’s Focus
Lithium shares fell on Tuesday, August 25, 2026, with Albemarle sliding almost 6% after a strong run tied to second-quarter results. The LIT ETF lost 0.57% to US$76.59 while SQM dropped 3.79% to US$79.21.
The driver was a sharp reversal in Chinese futures: the LC2609 contract on the Guangzhou Futures Exchange closed at 149,300 CNY per tonne after trading as high as 157,980 CNY earlier in the session. Spot indices also softened, with battery-grade carbonate down nearly 400 USD per tonne.
The move fits a broader pattern of investors locking in gains after Albemarle beat earnings expectations on August 5, with Chinese lithium prices still roughly double their year-ago levels. Chinese sellers, however, were holding back spot material, a sign of tightness in parts of the physical market.
What matters today. Whether Tuesday’s futures reversal marks a one-day reset or the start of a deeper correction in lithium shares that have priced in a strong demand rebound.
01 The session in one read
Lithium miners fell broadly on Tuesday, August 25, 2026, as Chinese futures gave back early gains. The LIT ETF, a basket of lithium miners and battery producers, closed at US$76.59, down 0.57%.
Albemarle, the US group that calls itself a world leader in transforming essential resources into critical ingredients, bore the brunt of the selling, dropping 5.89% to US$133.18. Chile’s SQM closed at US$79.21, down 3.79%.
The slide in NYSE-listed lithium names tracked the Guangzhou Futures Exchange reversal rather than any deterioration in Albemarle’s fundamentals. Albemarle’s fall of 5.89% on Tuesday looks like an unwind of recent outperformance after its second-quarter results beat expectations, with an average realized price of US$19.53 per kilogram of lithium carbonate equivalent and full-year volume guidance of 225 to 235 kilotons. The variable to watch is whether LC2609 holds above 149,000 CNY per tonne in coming sessions or breaks lower.
02 The board
The price board showed a clearly cautious tone across lithium proxies. Albemarle’s 5.89% drop was the standout, more than ten times the decline in the broader LIT ETF, which held up better thanks to diversification across miners and battery makers.
SQM’s 3.79% fall to US$79.21 left it closer to Albemarle’s trajectory than the fund, reflecting its heavier exposure to Chilean brine operations and Chinese spot pricing.
| Asset | Level | Change |
|---|---|---|
| Lithium (LIT ETF) | US$76.59 | -0.57% |
| Albemarle | US$133.18 | -5.89% |
| SQM | US$79.21 | -3.79% |
Source: RT close, 2026-08-25. Where a commodity has no spot feed, an exchange-traded tracker or leading producer is shown as a labelled proxy.
Live Market IntelligenceThe live market board
Rio Times · Live Market Intelligence
Latin America — Cross-Market Board
| Instrument | Last | Change | YoY | Prev. | High | Low | Volume |
|---|---|---|---|---|---|---|---|
| IBOV | 209,066.90 | +1.38% | +21.85% | 206,220.24 | 168,310 | 167,142 | — |
| IPSA | 11,044.42 | +0.18% | — | 11,024.22 | 11,210 | 10,984 | 1,513,213,483 |
| IPC MEX | 66,048.57 | +1.63% | +12.17% | 64,986.91 | 66,121 | 65,405 | 108,886,187 |
| MERVAL | 2,828,027 | -0.16% | +30.51% | 3,022,485 | 3,042,365 | 2,991,150 | — |
| COLCAP | 2,531.15 | +0.21% | — | 9.04 | 9.05 | 9.02 | 4,133 |
| BVL PERÚ | 59,610.00 | +2.26% | — | — | — | — | — |
| USD/BRL | 5.16 | +0.01% | -5.13% | 5.16 | 5.18 | 5.14 | — |
| EUR/BRL | 5.95 | +1.01% | -5.83% | 5.89 | 5.98 | 5.94 | — |
| USD/MXN | 17.06 | -0.24% | -8.58% | 17.10 | 17.08 | 17.01 | — |
| USD/CLP | 913.98 | +0.04% | -5.67% | 913.65 | 915.11 | 906.68 | — |
| USD/COP | 3,140 | +0.03% | -22.04% | 3,139 | 3,141 | 3,105 | — |
| USD/PEN | 3.36 | -0.66% | -4.82% | 3.38 | 3.38 | 3.35 | — |
| USD/ARS | 1,493 | +0.10% | +12.96% | 1,491 | 1,494 | 1,480 | — |
| USD/UYU | 40.27 | +1.24% | +1.80% | 39.77 | 40.27 | 40.23 | — |
| USD/PYG | 5,939 | +1.68% | -19.54% | 5,841 | 5,939 | 5,925 | — |
| USD/BOB | 11.64 | -0.76% | +72.04% | 11.73 | 11.72 | 11.64 | — |
| USD/DOP | 58.34 | +1.25% | -3.44% | 57.62 | 58.34 | 58.04 | — |
| USD/CRC | 445.92 | +0.89% | -9.71% | 441.97 | 448.50 | 445.92 | — |
Live Company IntelligenceSociedad Quimica y Minera de Chile SA ADR B — the full investor dossier
Wall Street view
Valuation & profitability
Price & risk
$41.0552-wk high
$96.09
Revenue trend · 6y
Ownership
Dividend
03 What moved it
The trigger was a reversal in Chinese lithium futures. The LC2609 contract on the Guangzhou Futures Exchange closed at 149,300 CNY per tonne, having traded as high as 157,980 CNY earlier in the day.
Spot indices also softened: the SMM Battery-Grade Lithium Carbonate Index averaged 20,615 USD per tonne, down 398.76 USD, while battery-grade lithium hydroxide dropped 490.8 USD to average 18,959.6 USD per tonne.
The reversal hit producer shares that had run up after Albemarle’s second-quarter results on August 5. Albemarle reported adjusted earnings of 3.75 USD per share on 1.7 billion USD in net sales, beating analyst expectations of 3.20 USD per share on 1.6 billion USD in revenue.
04 The Latin American read
For the Lithium Triangle of Chile, Argentina and Bolivia, Tuesday’s declines came with a nuance. SMM reported that Chinese lithium chemical plants were reluctant to sell spot material, with indicative offers around 155,000 to 160,000 yuan a tonne against downstream buying interest at or below 155,000 — a sign of physical tightness even as paper futures fell.
SQM’s 3.79% drop hit Chilean exposure hardest among the names we track. Argentina’s brine producers are not listed on the same board, but the Chinese futures signal matters for export prices across the region.
The direction of travel remains supportive in the medium term: Albemarle expects 2026 sales volumes of 225 to 235 kilotons of lithium carbonate equivalent, with higher Wodgina output offsetting a fire-related delay at Talison’s CGP3 plant.
05 The names to watch
Albemarle is the bellwether. Its fall to US$133.18 on Tuesday erased part of the gains that followed its strong second-quarter earnings on August 5.
SQM, at US$79.21, tracks Chilean brine production and Chinese chemical pricing, making it the purest listed bet on the Lithium Triangle’s cost curve.
The LIT ETF, down 0.57% to US$76.59, offers the broadest exposure, but its diversification also mutes the single-name swings seen in Albemarle and SQM.
06 The outlook
The key question is whether the Guangzhou reversal extends. LC2609 closed well below its intraday high, but prices remain within the range that has supported producer margins this year.
Albemarle’s full-year guidance of 225 to 235 kilotons of lithium carbonate equivalent and net sales of 5.7 to 6.0 billion USD under its mid-case pricing scenario points to continued volume growth, but Tuesday’s share price fall warns that bullish news is already in the price.
For investors in Latin American lithium, the watchword is contract lag. Albemarle’s realized price of 19.53 USD per kilogram sits a little below spot index levels near 20.6 USD per kilogram, showing that spot moves take time to reach producer revenues — in both directions.
07 What to watch
- Guangzhou futures: Whether LC2609 holds above 149,000 CNY per tonne or breaks lower will set the tone for lithium shares globally.
- Chinese spot offers: SMM reported sellers holding back material; if this persists, it would signal physical tightness offsetting futures weakness.
- Albemarle realized prices: With realized prices still trailing spot indices, next quarter’s figure will show whether Tuesday’s spot drop feeds into producer margins.
- SQM volume guidance: Any update on Chilean brine expansion could change the supply picture for the Lithium Triangle.
Frequently Asked Questions
Why did Albemarle fall more than the LIT ETF?
Albemarle’s 5.89% drop came after a strong run tied to its second-quarter earnings beat, making it vulnerable when Chinese futures reversed and investors locked in gains.
What is the LIT ETF?
LIT is an exchange-traded fund that holds shares of lithium miners and battery producers, so it tracks the sector rather than the raw material’s spot price.
Did the physical lithium market also fall?
Spot indices for battery-grade carbonate and hydroxide fell on August 25, but Chinese sellers were holding back material, indicating tightness in some physical markets.
What matters most for Latin America?
The Lithium Triangle’s export prices hinge on Chinese futures and spot indices, which fell on Tuesday but remain at levels roughly double year-ago figures.
Market data: RT
This article was produced by The Rio Times’ automated newsroom system. How we use AI · Report an error · Editorial responsibility: Matthias Camenzind, Editor-in-Chief
LatAm Markets: Live Signals → — real-time movers, turnover leaders and FX across Latin America.