Lithium Wrap: Albemarle Slides While the LIT Fund Steadies
Key Facts
- LIT ETF steady The Global X Lithium & Battery Tech ETF closed at US$69.85, down a marginal 0.24 percent in New York.
- Albemarle dropped Albemarle shares fell 3.51 percent to US$109.47, the sharpest move among the major lithium names.
- SQM slipped Chile’s SQM closed at US$68.68, a decline of 0.88 percent on the session.
- Fed decision rippled A hawkish Federal Reserve interest-rate hike pressured metals-linked equities across the board.
- Supply still the story Weakness in lithium shares reflects supply forecasts rather than weakening EV battery demand, according to Rio Times archive notes.
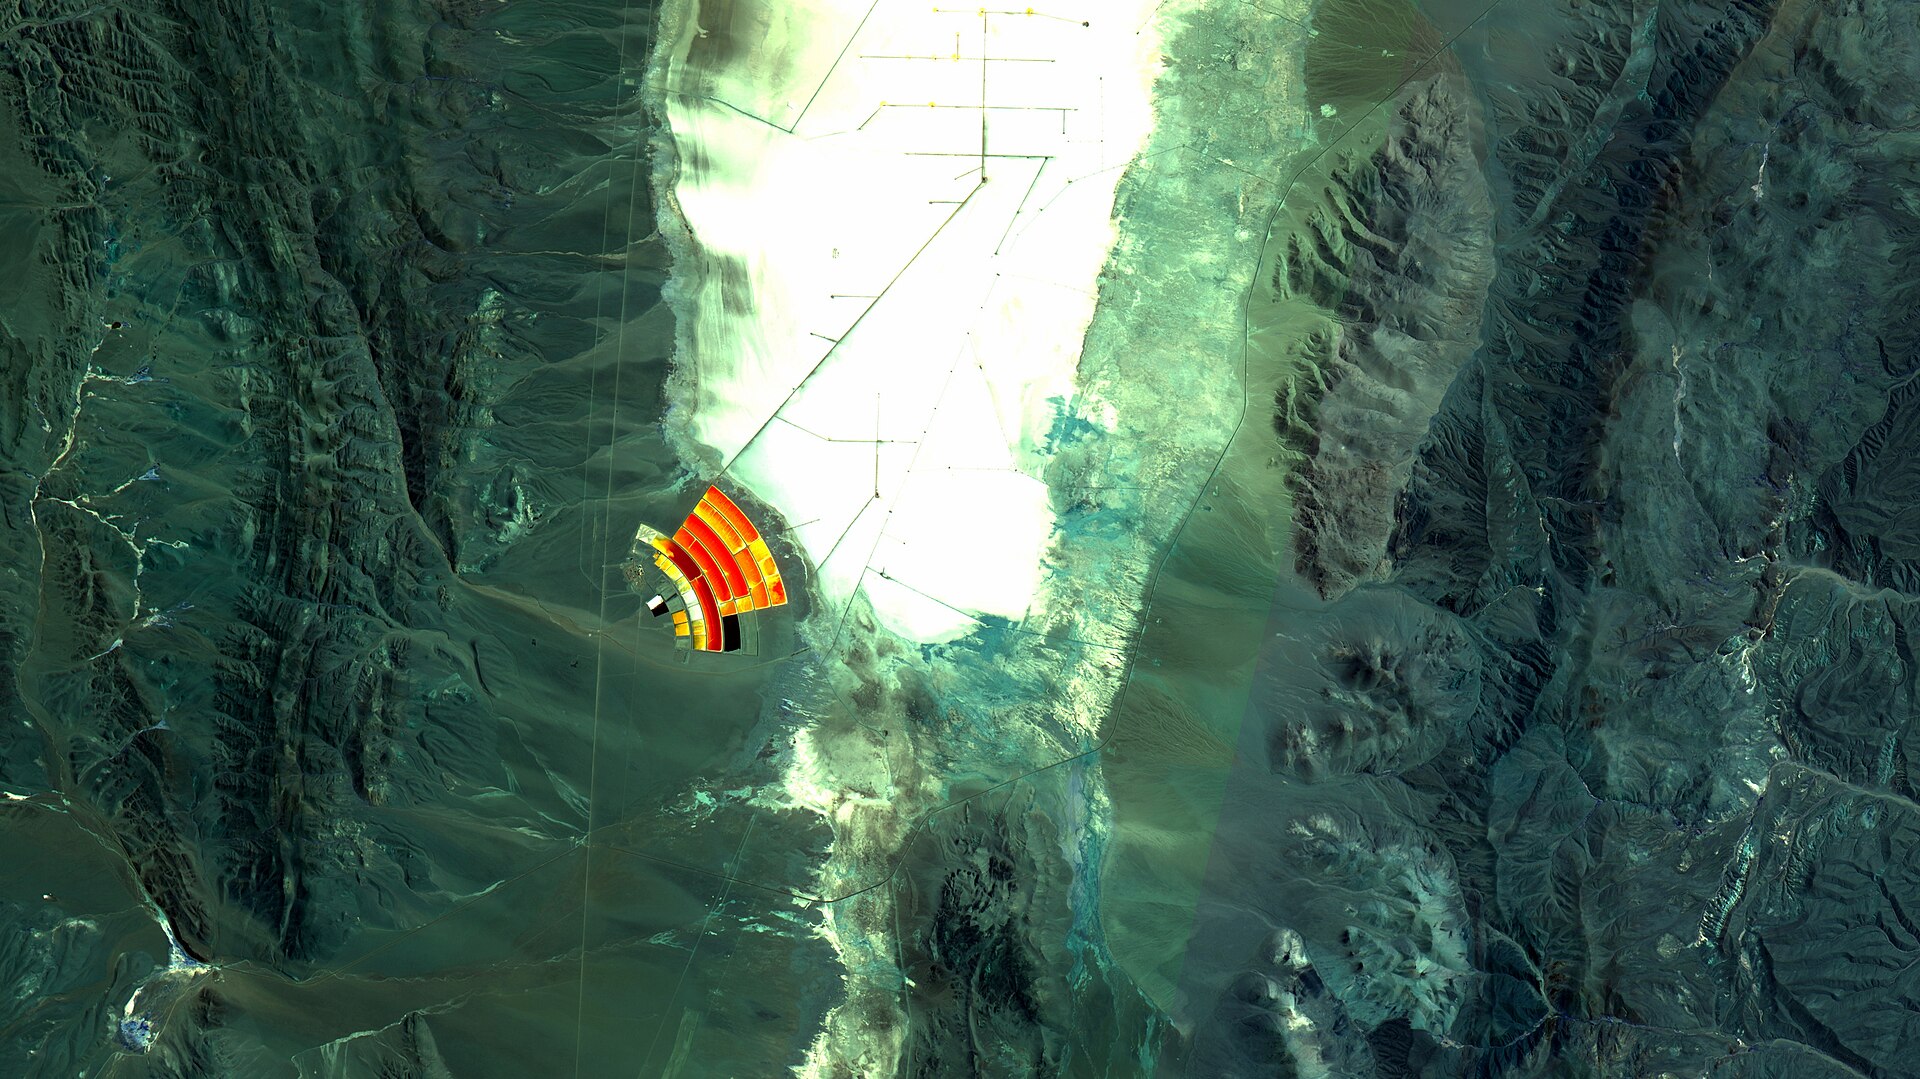
- Triangle dominance Chile, Argentina and Bolivia anchor roughly 56 percent of global lithium reserves, making the region central to the trade.
Today’s Focus
Lithium equities closed mixed to lower on Wednesday, September 16, 2026, as a hawkish turn from the Federal Reserve pressured growth-sensitive sectors. The LIT fund slipped just 0.24 percent, but Albemarle’s 3.51 percent drop signalled clear discomfort among producers.
The slide came despite firm physical-market signals elsewhere: FOB South America battery-grade lithium carbonate rose, while Chinese average prices fell. For investors, the session was a reminder that lithium shares trade on Federal Reserve policy and future supply just as much as on EV demand.
Chile’s SQM fell less than 1 percent, holding up better than its US rival. The region’s long-term position remains strong, with Rio Times research noting Latin America holds about 60 percent of identified lithium resources.
What matters today. The divergence between a stabilising LIT fund and falling producers shows macro policy still drives lithium equities.
01 The session in one read
Lithium mining equities had a split-personality session on Wednesday, September 16, 2026. The LIT ETF, which tracks miners and battery producers rather than the metal itself, was basically flat, easing 0.24 percent.
But the two biggest named producers diverged sharply from that calm. Albemarle slumped 3.51 percent while SQM’s loss was a more modest 0.88 percent.
Behind the divergence was a macro event, not a lithium-specific story: a hawkish Federal Reserve rate decision that rippled through interest-rate-sensitive growth assets.
Thecleartriggerfor Wednesday’sproducerlosseswasthe Federal Reserve’s12-0votefora25basispointhike,withmostpolicymakerssignallinganotherincreasethisyear.Thathurtgrowth-linkedmaterialsstocks,with Albemarlebearingthebrunt.Thevariabletowatchiswhether China’sspotlithiumpricedeclinedeepens,pressuringproducersharesfurther.
02 The board
The Global X Lithium & Battery Tech ETF closed at US$69.85, just 0.24 percent lower. That steadiness masked real pain in the largest component, Albemarle, which fell to US$109.47.
Chile’s SQM closed at US$68.68, down 0.88 percent on the day. No price on this board touched a new high or low; the moves were moderate but directionally clear: producers down, the diversified fund barely changed.
| Asset | Level | Change |
|---|---|---|
| Lithium (LIT ETF) | US$69.85 | -0.24% |
| Albemarle | US$109.47 | -3.51% |
| SQM | US$68.68 | -0.88% |
Source: RT close, 2026-09-16. Where a commodity has no spot feed, an exchange-traded tracker or leading producer is shown as a labelled proxy.
Live Market IntelligenceThe live market board
Rio Times · Live Market Intelligence
Latin America — Cross-Market Board
| Instrument | Last | Change | YoY | Prev. | High | Low | Volume |
|---|---|---|---|---|---|---|---|
| IBOV | 185,547.66 | -0.51% | +21.85% | 186,502.64 | 168,310 | 167,142 | — |
| IPSA | 11,235.54 | -0.77% | — | 11,322.60 | 11,210 | 10,984 | 1,513,213,483 |
| IPC MEX | 63,507.11 | -1.11% | +12.17% | 64,216.98 | 66,121 | 65,405 | 108,886,187 |
| MERVAL | 3,028,871 | -1.65% | +30.51% | 3,022,485 | 3,042,365 | 2,991,150 | — |
| COLCAP | 2,511.76 | -2.16% | — | 9.04 | 9.05 | 9.02 | 4,133 |
| BVL PERÚ | 58,496.57 | +0.80% | — | — | — | — | — |
| USD/BRL | 5.16 | +0.01% | -5.13% | 5.16 | 5.18 | 5.14 | — |
| EUR/BRL | 5.95 | +1.01% | -5.83% | 5.89 | 5.98 | 5.94 | — |
| USD/MXN | 17.06 | -0.24% | -8.58% | 17.10 | 17.08 | 17.01 | — |
| USD/CLP | 913.98 | +0.04% | -5.67% | 913.65 | 915.11 | 906.68 | — |
| USD/COP | 3,140 | +0.03% | -22.04% | 3,139 | 3,141 | 3,105 | — |
| USD/PEN | 3.36 | -0.66% | -4.82% | 3.38 | 3.38 | 3.35 | — |
| USD/ARS | 1,493 | +0.10% | +12.96% | 1,491 | 1,494 | 1,480 | — |
| USD/UYU | 40.27 | +1.24% | +1.80% | 39.77 | 40.27 | 40.23 | — |
| USD/PYG | 5,939 | +1.68% | -19.54% | 5,841 | 5,939 | 5,925 | — |
| USD/BOB | 11.64 | -0.76% | +72.04% | 11.73 | 11.72 | 11.64 | — |
| USD/DOP | 58.34 | +1.25% | -3.44% | 57.62 | 58.34 | 58.04 | — |
| USD/CRC | 445.92 | +0.89% | -9.71% | 441.97 | 448.50 | 445.92 | — |
Live Company IntelligenceSociedad Quimica y Minera de Chile SA ADR B — the full investor dossier
Wall Street view
Valuation & profitability
Price & risk
$39.7952-wk high
$96.09
Revenue trend · 6y
Ownership
Dividend
03 What moved it
The Federal Reserve voted 12-0 for a quarter-point rate hike on Wednesday, and 16 of 18 policymakers saw another increase coming in 2026. That hawkish tilt hit gold and other metals-linked equities, and lithium names were swept along.
The drop in Albemarle was the clearest sign that macro policy still dominates trading in lithium shares. A separate Rio Times note argued that sector weakness often reflects supply forecasts, especially from Australia and China, rather than soft EV battery demand.
Physical-market signals were mixed: battery-grade lithium carbonate in China fell, but FOB South America product rose. This split added a layer of uncertainty for traders trying to read underlying demand.
04 The Latin American read
For Chile, Argentina and Bolivia the session was a reminder that being rich in lithium does not insulate local producers from US monetary policy. Chile’s SQM fell, albeit less than Albemarle, reflecting its lower valuation multiple and different investor base.
The strategic position of the Lithium Triangle remains powerful. Rio Times research shows the region holds about 56 percent of global lithium reserves and, with roughly 60 percent of identified resources, is essential to any long-term EV battery supply chain.
Yet the immediate marginal tonne of supply growth is coming from hard-rock projects in Australia and brine expansions in China, not from new Triangle output. That keeps a lid on prices despite robust demand forecasts.
05 The names to watch
Albemarle is the world’s largest lithium producer and the most liquid US-listed proxy for the trade. Wednesday’s 3.51 percent slide makes it the bellwether for how rate expectations hit high-multiple materials stocks.
SQM’s smaller decline suggests investors see its Chilean assets, including Atacama brine rights, as a comparatively defensive play. The LIT fund’s flat close shows that losses were concentrated in a few big producers, not across every battery-exposed name.
06 The outlook
Thursday’s trading will test whether Wednesday’s Fed-driven drop was a one-day shakeout or the start of a larger de-rating for lithium equities. Watch whether Albemarle stabilises or extends its move below US$109.
Beyond the Fed, the key lithium-specific variable is China’s spot carbonate price. Another down day there would reinforce the supply-glut narrative, even as South American FOB prices show resilience.
For long-term investors, the arithmetic still favours lithium: one study cited by Rio Times projects global demand could triple by 2030. But the market’s discount rate has just gone up.
07 What to watch
- Fed follow-through: Whether US rate expectations keep rising will determine if lithium equity losses extend.
- China spot carbonate: Another decline in Chinese battery-grade carbonate would deepen the supply-glut narrative.
- Albemarle support level: Whether Albemarle holds US$109 or breaks lower will set the tone for the sector.
- EV sales data: Strong September EV deliveries would help decouple lithium shares from macro pessimism.
Frequently Asked Questions
Why did Albemarle fall so much?
A hawkish Federal Reserve rate hike hit growth-linked equities, and Albemarle is the largest, most liquid US lithium producer.
Did lithium prices crash on Wednesday?
No single physical price crashed. Chinese carbonate fell while FOB South America rose; the equity losses were driven by the Fed.
Is the LIT ETF a spot lithium price?
No. LIT holds shares of lithium miners and battery producers, giving exposure to the industry, not the physical metal.
Why does the Lithium Triangle matter?
Chile, Argentina and Bolivia hold about 56 percent of global lithium reserves, making them central to future EV supply.
Market data: RT
This article was produced by The Rio Times’ automated newsroom system. How we use AI · Report an error
LatAm Markets: Live Signals → — real-time movers, turnover leaders and FX across Latin America.
Read More from The Rio Times