Grain Prices Fall After USDA Raises World Wheat Stocks
Key Facts
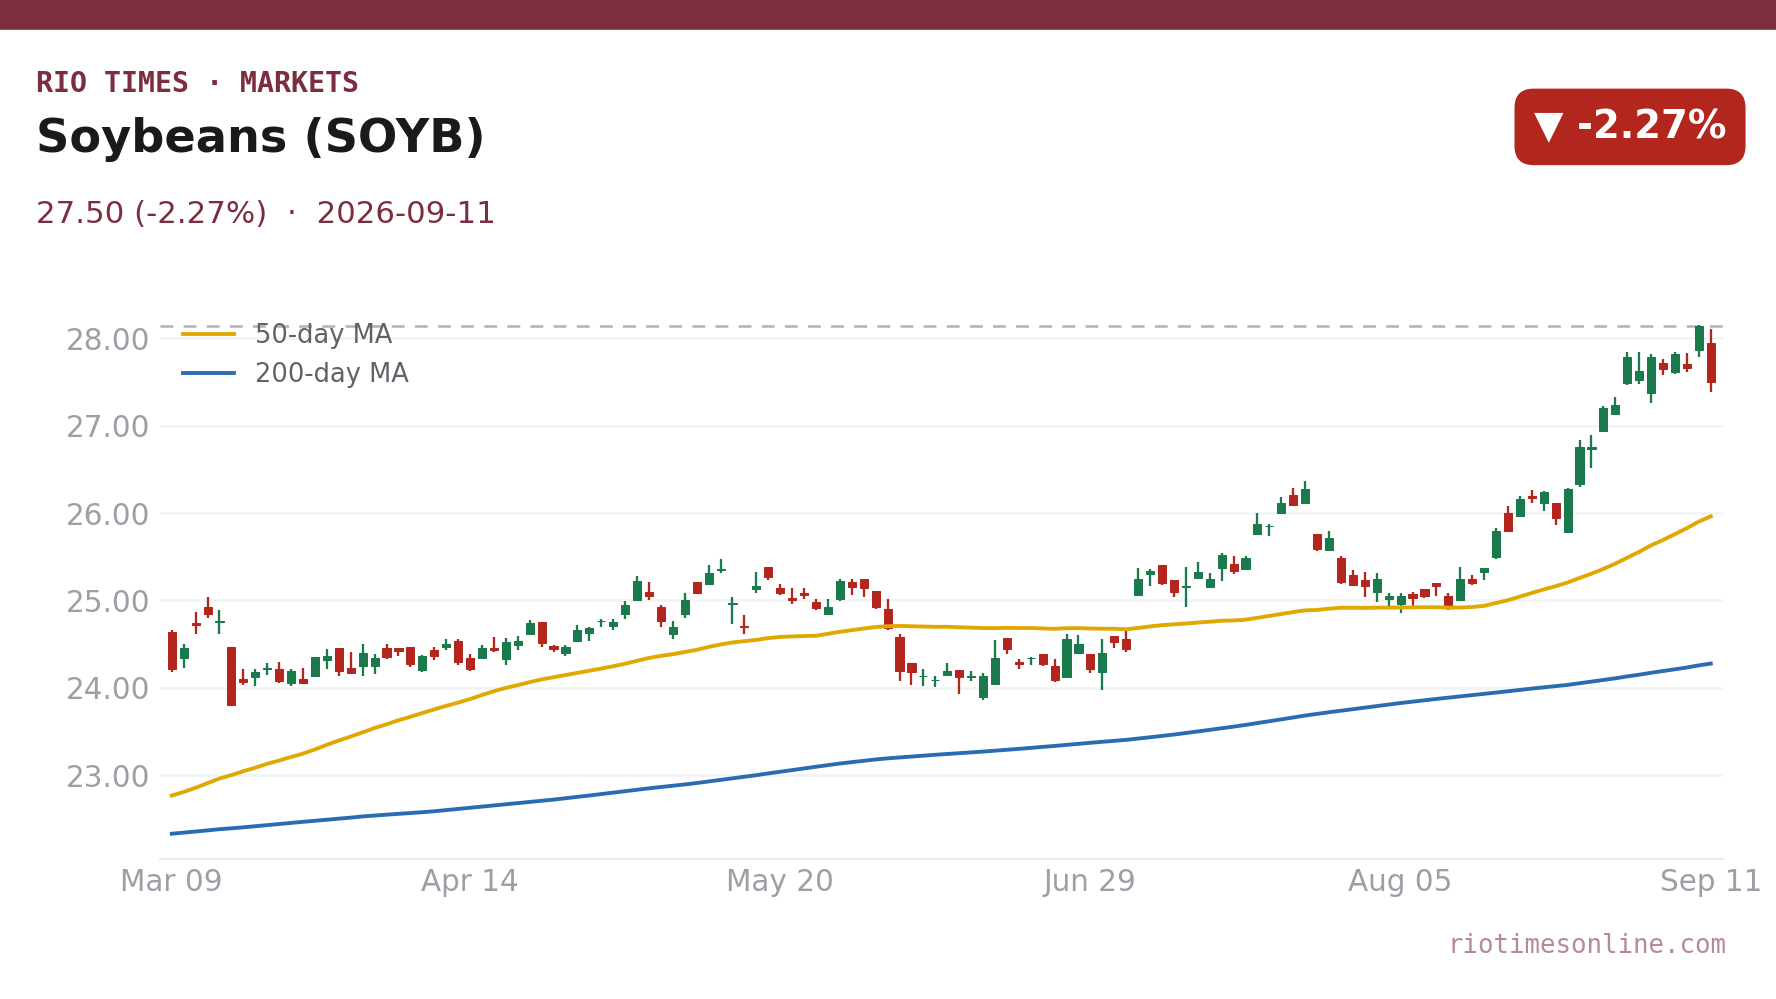
- Soybean trackers slid hard. The Teucrium Soybean Fund closed at US$27.50, a drop of 2.27% on the session.
- Corn was more resilient. The Teucrium Corn Fund settled at US$19.92, easing only -0.45% as a US yield cut was already priced in.
- Wheat surrendered its war premium. The Teucrium Wheat Fund finished at US$26.25, down 1.72% despite fresh Black Sea shipping threats.
- China demand remains the anchor. Brazil and Argentina are still the export engine, but the US harvest is providing more competition for soybean cargoes.
- The Brazilian real is a headwind. At 5.12 per US dollar it has firmed about 4% in 2026, squeezing farmgate margins.
- USDA lifted US soybean output. The September 11 report raised production to a record 4.535 billion bushels, yet cut ending stocks to a tight 310 million.
Today’s Focus
Grain-linked funds fell on Friday, September 11, 2026, as a more comfortable global supply picture outweighed fresh nerves about the Black Sea. The move was led by soybeans, where the Teucrium Soybean Fund dropped 2.27% to US$27.50.
Corn held up better, with the Teucrium Corn Fund easing just -0.45% to US$19.92. Traders had already absorbed the US government’s lower yield number, leaving little fresh selling pressure.
Wheat gave back its war premium, with the Teucrium Wheat Fund sliding 1.72% to US$26.25. Russia and Ukraine supply about 27% of global wheat exports, but the last confirmed strikes on grain ships were in August.
For Brazil and Argentina, the session was a reminder that US harvest competition is intensifying. A firmer real, however, is eroding Brazilian farm margins.
What matters today. Whether the larger US soybean crop is enough to permanently cap prices even as China keeps buying from Brazil and Argentina.
01 The session in one read
Grain trackers closed firmly lower on Friday, September 11, 2026, with the sharpest pressure on soybeans. The Teucrium Soybean Fund lost 2.27% to settle at US$27.50 as a larger American harvest loomed over the market.
The move had little to do with weak demand from Asia. China’s buying remains the core of the trade. A 10% retaliatory tariff on American beans still steers commercial buyers towards Brazil.
Friday’s decline was about supply expansion, not softening demand. The USDA raised soybean production to 4.535 billion bushels and yield to 52.8 bushels an acre. Ending stocks still fell, to 310 million bushels. Corn yield was cut to 178.5 bushels an acre and the stocks-to-use ratio dropped below 10%. Wheat fell because world ending stocks came in at 276.29 million tonnes, above the 273.46 million the trade expected. The variable to watch is whether US harvest pressure continues to drag soybean prices lower into the next WASDE.
02 The board
Soybeans led the declines, with the soybean tracker at US$27.50. Corn showed relative strength, giving up only -0.45% to US$19.92, a sign that traders had already priced in the US yield adjustment.
Wheat fell 1.72% to US$26.25. The driver was the report itself. World wheat ending stocks came in nearly three million tonnes above expectations.
| Asset | Level | Change |
|---|---|---|
| Soybeans (SOYB) | US$27.50 | -2.27% |
| Corn (CORN) | US$19.92 | -0.45% |
| Wheat (WEAT) | US$26.25 | -1.72% |
Trade date 2026-09-11. Futures settlements from CME Group; fund closes from RT. Where a commodity has no spot feed, an exchange-traded tracker or leading producer is shown as a labelled proxy.
December corn settled at 530.25 cents a bushel, down 3.5 cents. November soybeans fell 35.75 cents to 1,296.50 and December Chicago wheat lost 16 cents to 725.25.
All three lost ground on the week. Corn fell 1.21%, soybeans 1.01% and Chicago wheat 1.19%.
CONAB’s August survey put Brazil’s 2025/26 soybean crop at a record 180.5 million tonnes and corn at 143 million. Argentina still taxes soybean exports at 24% and corn at 8.5%.
Live Market IntelligenceThe live market board
Rio Times · Live Market Intelligence
Latin America — Cross-Market Board
| Instrument | Last | Change | YoY | Prev. | High | Low | Volume |
|---|---|---|---|---|---|---|---|
| IBOV | 187,206.89 | -0.56% | +21.85% | 188,268.59 | 168,310 | 167,142 | — |
| IPSA | 11,220.60 | -0.16% | — | 11,238.58 | 11,210 | 10,984 | 1,513,213,483 |
| IPC MEX | 63,924.77 | -0.28% | +12.17% | 64,106.82 | 66,121 | 65,405 | 108,886,187 |
| MERVAL | 3,098,898 | -1.87% | +30.51% | 3,022,485 | 3,042,365 | 2,991,150 | — |
| COLCAP | 2,589.69 | -1.41% | — | 9.04 | 9.05 | 9.02 | 4,133 |
| BVL PERÚ | 59,373.28 | — | — | — | — | — | — |
| USD/BRL | 5.16 | +0.01% | -5.13% | 5.16 | 5.18 | 5.14 | — |
| EUR/BRL | 5.95 | +1.01% | -5.83% | 5.89 | 5.98 | 5.94 | — |
| USD/MXN | 17.06 | -0.24% | -8.58% | 17.10 | 17.08 | 17.01 | — |
| USD/CLP | 913.98 | +0.04% | -5.67% | 913.65 | 915.11 | 906.68 | — |
| USD/COP | 3,140 | +0.03% | -22.04% | 3,139 | 3,141 | 3,105 | — |
| USD/PEN | 3.36 | -0.66% | -4.82% | 3.38 | 3.38 | 3.35 | — |
| USD/ARS | 1,493 | +0.10% | +12.96% | 1,491 | 1,494 | 1,480 | — |
| USD/UYU | 40.27 | +1.24% | +1.80% | 39.77 | 40.27 | 40.23 | — |
| USD/PYG | 5,939 | +1.68% | -19.54% | 5,841 | 5,939 | 5,925 | — |
| USD/BOB | 11.64 | -0.76% | +72.04% | 11.73 | 11.72 | 11.64 | — |
| USD/DOP | 58.34 | +1.25% | -3.44% | 57.62 | 58.34 | 58.04 | — |
| USD/CRC | 445.92 | +0.89% | -9.71% | 441.97 | 448.50 | 445.92 | — |
03 What moved it
The dominant driver was the US Department of Agriculture’s September supply report, which raised the outlook for the 2026 American soybean crop. Higher production and yield forecasts signalled more abundant supply, directly pressuring soybean sentiment.
Corn escaped much of the damage because the same report trimmed the US yield number. Corn’s stocks-to-use ratio fell below 10%. Even so, traders sold the fact and took profits.
04 The Latin American read
For Brazilian and Argentine growers, the session was a mixed bag. Lower dollar prices for soybeans and wheat cut into export revenue, and a firmer real, at 5.12 per US dollar, deepens the squeeze in local currency.
The competitive stakes are rising. As the US harvest advances, buyers in China gain alternatives to Brazilian soybeans, particularly on new-crop positions. Port premiums at Santos and Paranaguá have held high, easing only slightly.
05 The names to watch
The Teucrium Soybean Fund, Corn Fund and Wheat Fund are the clearest proxies for price direction. Their Friday closes of US$27.50, US$19.92 and US$26.25 respectively capture a uniformly defensive mood.
Beyond the funds, watch large Brazilian producers and exporters. The real and Centro-Oeste logistics costs will decide whether lower global prices dent farmgate incomes.
06 The outlook
The next few sessions hinge on whether the US harvest continues to come in above expectations. If it does, soybean and corn trackers could see another leg lower, pressure that would flow directly into Brazilian export premia.
07 What to watch
- US harvest pace: Faster-than-expected American soybean and corn harvesting will keep a lid on global prices and pressure Brazil’s port premiums.
- China purchase patterns: Any slowdown in Chinese buying of Brazilian soybeans, or a shift to US new-crop supply, would signal a meaningful demand rotation.
- Brazilian real: The real has already firmed to 5.12 per US dollar, squeezing farmgate margins for Brazilian soy and corn producers if dollar prices remain under pressure.
- Black Sea shipping insurance: Any escalation in attacks on Ukrainian wheat cargoes could reinstall a war premium in wheat prices, reversing Friday’s decline.
Frequently Asked Questions
Why did grain-linked funds fall on Friday?
The US government raised its 2026 soybean production forecast, signalling more global supply and triggering profit-taking across the grains complex.
Why did corn hold up better than soybeans or wheat?
The US corn yield was cut to 178.5 bushels an acre. That tightened the balance sheet and limited the selling.
How do these US moves affect Brazil and Argentina?
Lower global prices reduce export revenue, and a real that has firmed about 4% this year compounds the squeeze.
What would reverse the current trend?
A genuine Black Sea disruption, or a slower US harvest, would break the supply narrative now dominating grains.
Market data: RT
This article was produced by The Rio Times’ automated newsroom system. How we use AI · Report an error
LatAm Markets: Live Signals → — real-time movers, turnover leaders and FX across Latin America.
Read More from The Rio Times