Key Facts
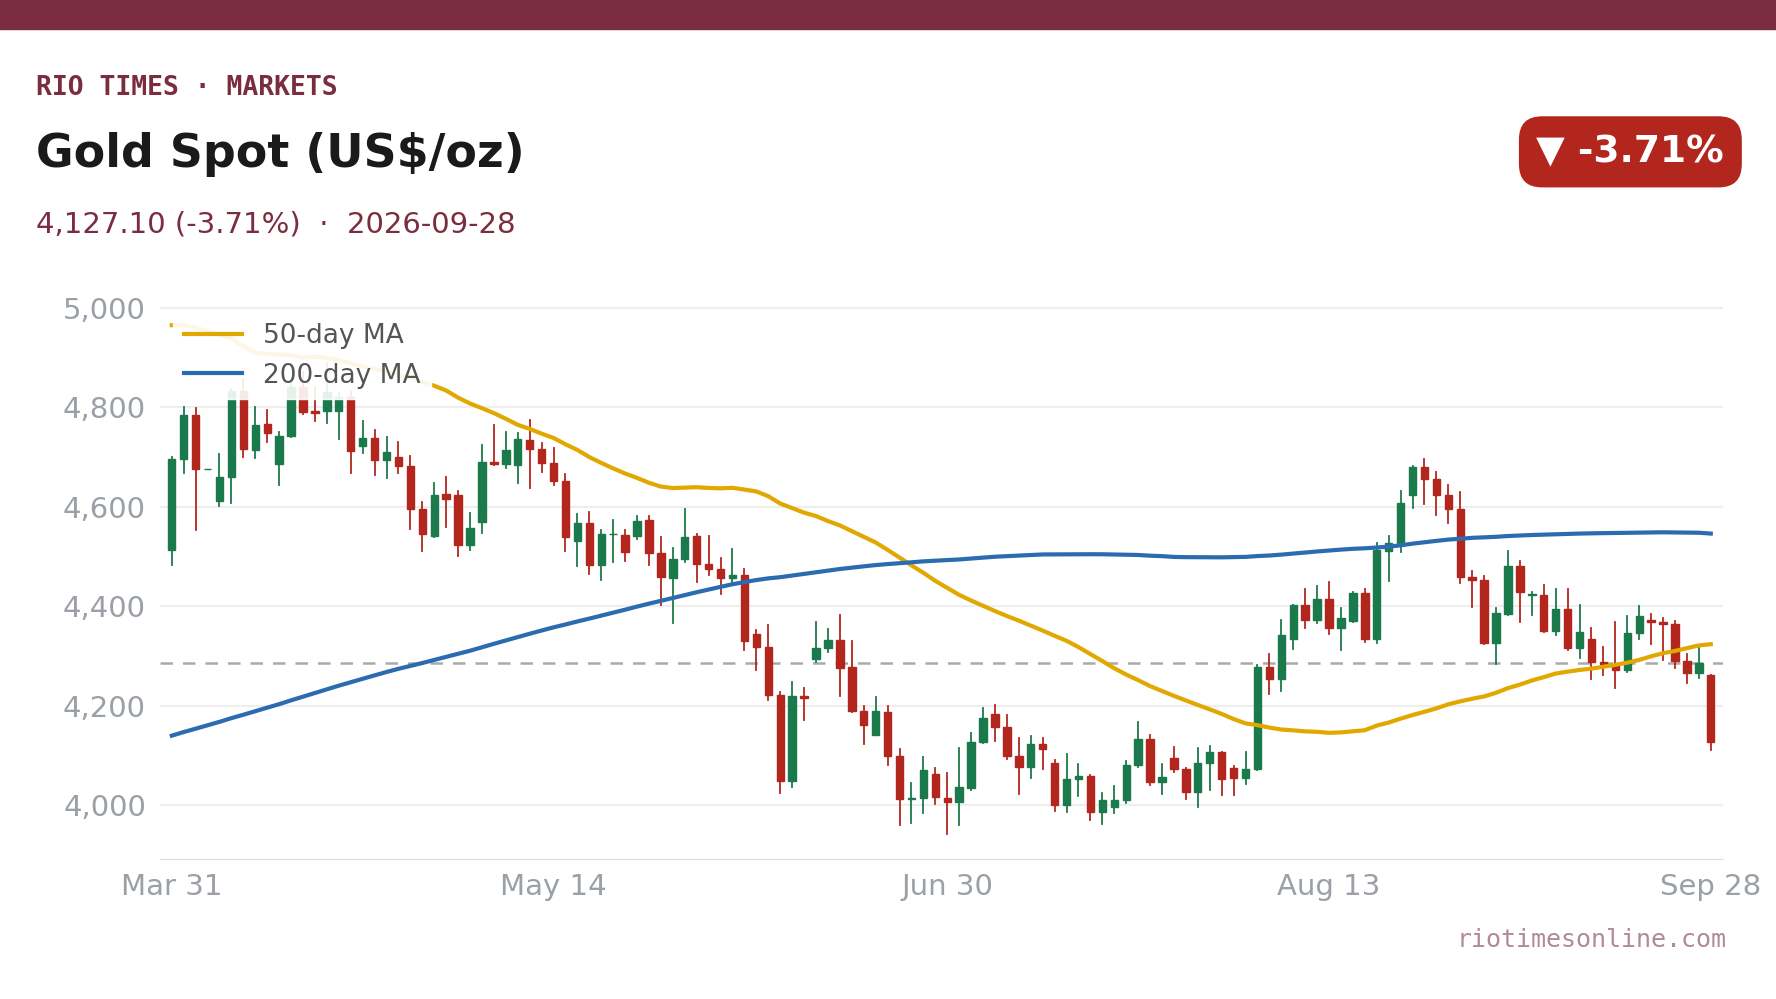
- Spot gold fell 3.71% from Friday’s close to US$4,127 an ounce on Monday, its lowest close since 4 August, as higher bond yields raised the opportunity cost of holding bullion.
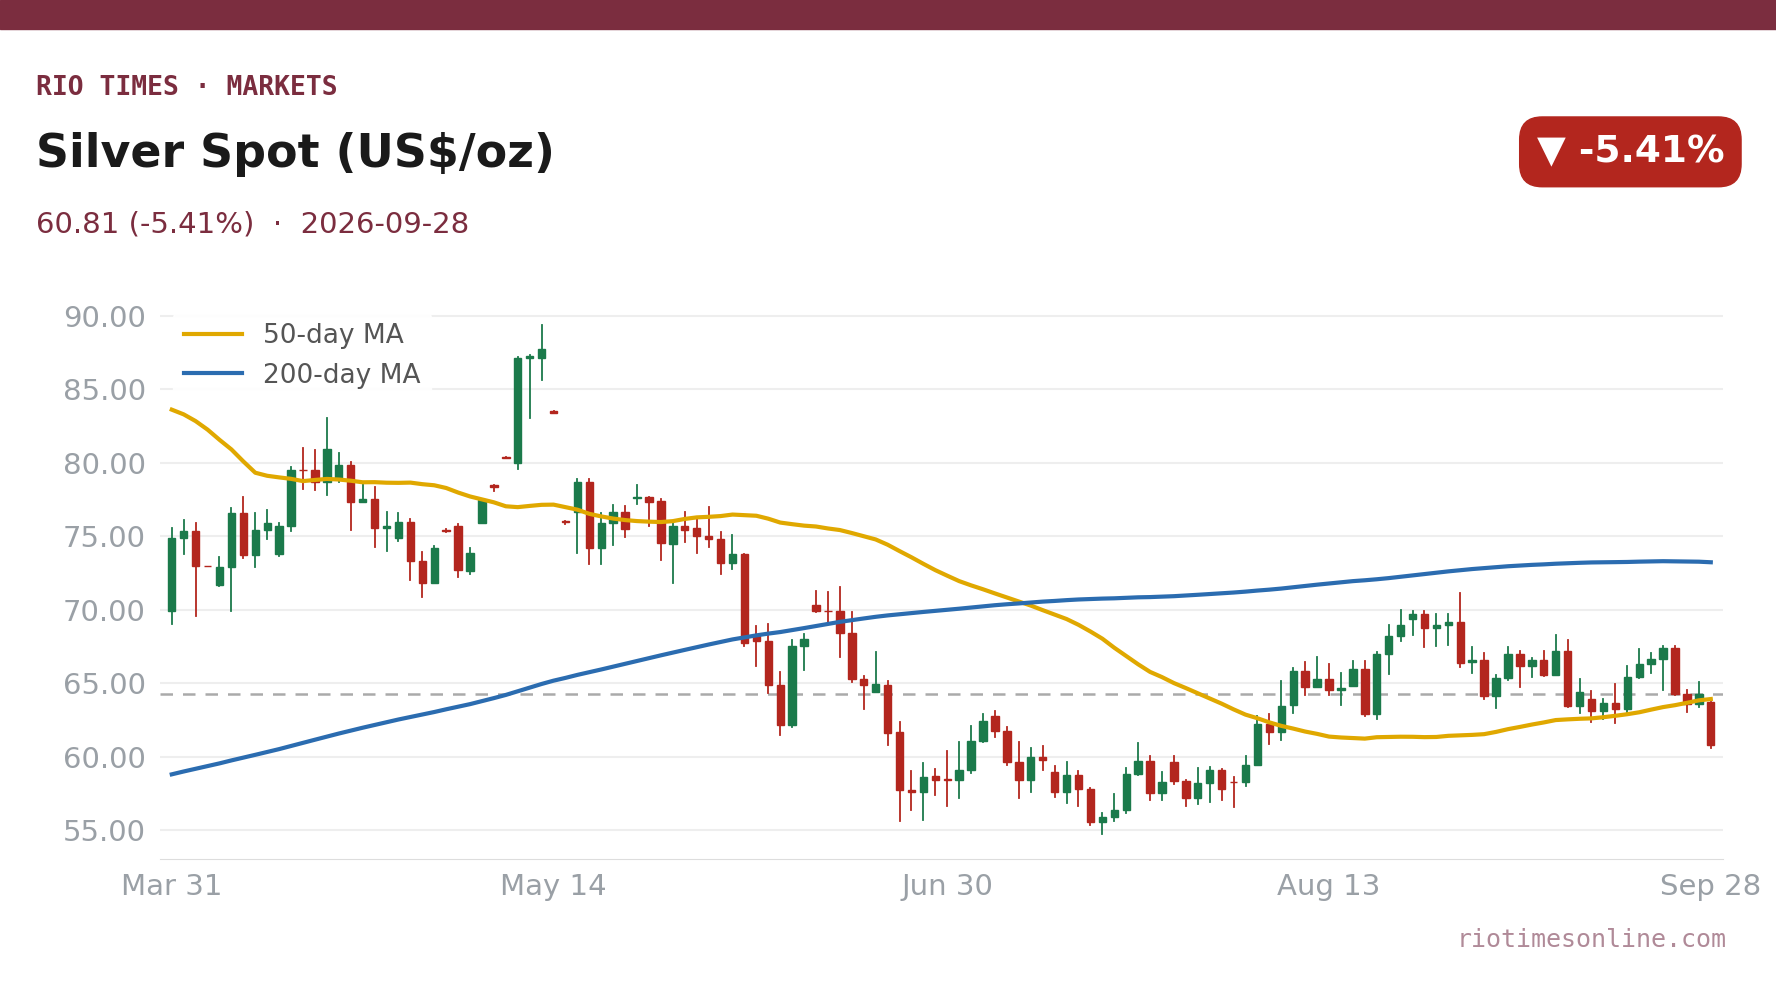
- Spot silver dropped 5.41% to US$60.81 an ounce, underperforming gold on concern about industrial demand.
- Rate-hike bets strengthened after rising oil prices revived inflation fears, pushing the US 10-year Treasury yield up to 5.24%.
- A firmer US dollar compounded the sell-off, making dollar-priced gold and silver more expensive for overseas buyers.
- Mexico is the world’s top silver producer, so the silver slide directly pressures mining revenues, exports and regional activity.
- Peru is the second-largest silver miner, recovering much of its silver alongside copper and gold, meaning weaker prices squeeze mining margins and tax receipts.
Today’s Focus
Gold and silver fell sharply on Monday, September 28, 2026, as rising Treasury yields, a firmer dollar and renewed Federal Reserve rate-hike expectations overwhelmed safe-haven demand. Spot gold settled at US$4,127 an ounce, down 3.71% from Friday, while silver dropped 5.41% to US$60.81 an ounce.
The trigger was oil-led inflation anxiety. Higher crude prices revived bets that the Federal Reserve, which raised rates on 16 September, will hike again in October, lifting bond yields and making non-interest-paying metals less attractive.
Silver’s heavier fall reflected its dual role. Beyond precious-metal selling, investors worried about industrial demand, hitting Latin American producers where export income and mining margins are most exposed.
For Mexico, the world’s top silver producer, and Peru, the second-largest, the session was a reminder that monetary policy in Washington moves prices from Zacatecas to the Andes.
What matters today. Rising real yields and dollar strength, not geopolitical anxiety, now drive the precious metals complex.
01 The session in one read
Gold and silver tumbled on Monday, September 28, 2026, as a jump in Treasury yields and a stronger dollar punished assets that pay no interest. Spot gold settled at US$4,127 an ounce, a decline of 3.71% from Friday’s close, while silver fell 5.41% to US$60.81 an ounce.
The drop came despite earlier geopolitical tension and oil-market disruption that had supported defensive demand. Those safe-haven flows were overwhelmed by renewed expectations of another Federal Reserve rate increase.
Rising oil prices revived inflation fears, and the US 10-year Treasury yield rose about eight basis points to 5.24%. That raised the opportunity cost of holding bullion, while the firmer dollar made dollar-priced metals more expensive for buyers abroad.
The session confirmed that higher borrowing costs currently outweigh geopolitical support for gold and silver. With markets pricing another Fed move, bullion will struggle until real yields peak. The variable to watch is the US 10-year real yield, which rose to 2.90% on Monday from 2.83% on Friday.
02 The board
Spot gold settled at US$4,127 an ounce, down 3.71% from Friday’s close. It was the metal’s lowest close since 4 August, after an intraday low of US$4,111.
Spot silver closed at US$60.81 an ounce, a drop of 5.41% and also its lowest close since 4 August. The heavier fall reflected silver’s sensitivity to industrial demand concerns alongside the precious-metal sell-off.
The spread between the two moves was telling: silver fell about 1.7 percentage points more than gold, signalling worry about manufacturing and global growth, not just monetary policy.
| Asset | Level | Change |
|---|---|---|
| Gold | US$4,127/oz | -3.71% |
| Silver | US$60.81/oz | -5.41% |
Source: RT close, 2026-09-28. Where a commodity has no spot feed, an exchange-traded tracker or leading producer is shown as a labelled proxy.
Live Market IntelligenceThe live market board
Rio Times · Live Market Intelligence
Latin America — Cross-Market Board
| Instrument | Last | Change | YoY | Prev. | High | Low | Volume |
|---|---|---|---|---|---|---|---|
| IBOV | 182,991.13 | -0.26% | +21.85% | 183,476.86 | 168,310 | 167,142 | — |
| IPSA | 11,137.59 | -1.06% | — | 11,256.80 | 11,210 | 10,984 | 1,513,213,483 |
| IPC MEX | 64,737.82 | -0.39% | +12.17% | 64,992.23 | 66,121 | 65,405 | 108,886,187 |
| MERVAL | 2,798,925 | -3.28% | +30.51% | 3,022,485 | 3,042,365 | 2,991,150 | — |
| COLCAP | 2,579.33 | -0.21% | — | 9.04 | 9.05 | 9.02 | 4,133 |
| BVL PERÚ | 60,698.35 | -0.79% | — | — | — | — | — |
| USD/BRL | 5.16 | +0.01% | -5.13% | 5.16 | 5.18 | 5.14 | — |
| EUR/BRL | 5.95 | +1.01% | -5.83% | 5.89 | 5.98 | 5.94 | — |
| USD/MXN | 17.06 | -0.24% | -8.58% | 17.10 | 17.08 | 17.01 | — |
| USD/CLP | 913.98 | +0.04% | -5.67% | 913.65 | 915.11 | 906.68 | — |
| USD/COP | 3,140 | +0.03% | -22.04% | 3,139 | 3,141 | 3,105 | — |
| USD/PEN | 3.36 | -0.66% | -4.82% | 3.38 | 3.38 | 3.35 | — |
| USD/ARS | 1,493 | +0.10% | +12.96% | 1,491 | 1,494 | 1,480 | — |
| USD/UYU | 40.27 | +1.24% | +1.80% | 39.77 | 40.27 | 40.23 | — |
| USD/PYG | 5,939 | +1.68% | -19.54% | 5,841 | 5,939 | 5,925 | — |
| USD/BOB | 11.64 | -0.76% | +72.04% | 11.73 | 11.72 | 11.64 | — |
| USD/DOP | 58.34 | +1.25% | -3.44% | 57.62 | 58.34 | 58.04 | — |
| USD/CRC | 445.92 | +0.89% | -9.71% | 441.97 | 448.50 | 445.92 | — |
03 What moved it
Higher oil prices rekindled inflation anxiety, strengthening the case for the Federal Reserve to raise rates again in October. That pushed the 10-year Treasury yield to 5.24% and lifted the dollar index 0.22%.
Real yields, which strip out inflation, climbed too: the 10-year real yield rose to 2.90% on Monday, from 2.83% on Friday and 2.68% a week earlier. For gold and silver, which pay no coupon or dividend, higher real yields directly increase the cost of holding an unproductive asset.
Safe-haven flows linked to geopolitical friction were simply outgunned. When the dollar strengthens alongside yields, even defensive buyers often step aside, and Monday’s session showed that dynamic in full force.
04 The Latin American read
Mexico, as the world’s top silver producer, feels a 5.41% daily drop immediately. Mining companies price export revenues in dollars, so a sliding silver price cuts dollar income directly. The peso weakened 1.3% to 17.94 per US dollar on Monday, according to the Bank of Mexico’s closing rate, which softens the blow in local-currency terms but not the fall in dollar revenue.
Peru, the second-largest silver miner, faces the same pressure. Many Peruvian operations recover silver as a by-product of copper and gold, meaning weaker silver compounds margin pressure across polymetallic mines in the Andes.
For both countries, lower silver prices mean reduced export income, potential pressure on tax receipts, and leaner times for regional economies tied to mining employment and services. Foreign investors should watch how quickly local producers adjust cost structures.
05 The names to watch
Mexico’s largest silver miners carry outsized sensitivity to Monday’s move, with revenue forecasts now likely to be revisited if silver remains near US$60 an ounce.
Peruvian producers with copper-heavy portfolios will feel silver’s slide as secondary pain. Those with higher silver exposure face sharper revisions, since silver fell more than gold and industrial demand worry adds another layer of risk.
Aakash Doshi, head of gold strategy at State Street Investment Management, still expects gold near US$5,000 an ounce by the second quarter of 2027. He warned that rising bond yields could first push prices towards US$4,000 within a week.
06 The outlook
The near-term direction of gold and silver hinges on whether the Federal Reserve follows through with another rate increase in October. If oil keeps climbing, inflation fears will keep yields elevated and metals under pressure.
A pause or reversal in real yields would quickly restore the case for bullion, especially with geopolitical tension still simmering. For now, the burden of proof sits with the bulls.
07 What to watch
- US 10-year real yield: A further rise would keep gold and silver under pressure; a peak could mark the metals’ floor.
- Federal Reserve October meeting: Any signal of another rate increase would reinforce the sell-off in non-yielding assets.
- Oil price direction: Higher crude feeds inflation expectations, driving yields upward and punishing gold and silver.
- Mexico and Peru miner earnings revisions: Analyst adjustments after the silver slide will reveal how exposed Latin American producers truly are.
Frequently Asked Questions
Why did gold fall on Monday?
Gold fell because higher Treasury yields, a firmer dollar and renewed Federal Reserve rate-hike expectations overwhelmed safe-haven demand.
Why did silver fall more than gold?
Silver fell more because it is sensitive to both precious-metal selling and concerns about industrial demand, adding extra downside pressure.
How does this affect Mexico and Peru?
Mexico is the world’s top silver producer and Peru ranks second, so lower silver prices directly pressure mining revenues, export income and tax receipts.
What should investors watch next?
Investors should watch US real yields, the Federal Reserve’s October decision, and whether oil prices continue to climb.
Source: RT live market data, close of Monday 28 September 2026
This article was produced by The Rio Times’ automated newsroom system. How we use AI · Report an error
LatAm Markets: Live Signals → — real-time movers, turnover leaders and FX across Latin America.
Read More from The Rio Times