
\n
\n
\n
\n
\n
\n
\n
\n
\n
\n
\n
\n
\n
\n
\n
\n
\n
\n
\n
\nGold crashes below $4,920 as the CPI rally is erased in a single session — the largest daily decline since the February 6 capitulation. XAU/USD opened at $4,993 and immediately failed to hold $5,000, sliding $134 intraday to a low of $4,858.23 before recovering to close at $4,918.34 (−1.49%). The move wipes out Friday’s entire CPI-driven recovery and then some, with gold now trading below the Tenkan-sen ($4,975) and pressing into the Ichimoku cloud ($4,887–$4,883). This is the first cloud penetration from above since the post-crash recovery began in early February, and a close below $4,883 would confirm a bearish cloud break.
\n
\nSilver plunges 2.15% to $74.94 with a devastating $72.74 intraday low — the worst session since the February 12 crash when XAG/USD fell 7.5%. The gold-silver ratio widened to 65.6 from 65.0, confirming silver’s higher-beta underperformance on risk-off days. The $72.74 low breaches the Ichimoku cloud support and the psychological $75 handle, dragging silver back toward the volatility zone that defined the first week of February. The MACD histogram at −2.414 is deeply negative, and RSI at 47.98 has rolled below the 50 neutral line — confirming the loss of all upward momentum from the CPI bounce.
\n
\nFOMC minutes due today become the make-or-break catalyst as metals enter a critical support zone with US markets reopening from Presidents’ Day. The DXY is essentially flat at 96.83, meaning the selloff is not dollar-driven — this is pure profit-taking and pre-FOMC positioning. Markets are pricing ~10% odds of a 25bp cut at the March 17–18 meeting, with two full cuts expected by year-end. S&P 500 futures are modestly lower (−0.13%), while the VIX has collapsed 14.65% to 18.58, suggesting equity markets don’t share precious metals’ anxiety. A dovish tone in the minutes could reverse this selloff sharply; a hawkish surprise risks pushing gold below $4,883 and silver below $72.
\n
\n
\n
\nSession Data
\n
| Asset | Price | Change |
|---|---|---|
| XAU/USD (Gold) | $4,918.34 | −1.49% |
| XAG/USD (Silver) | $74.935 | −2.15% |
| DXY (Dollar Index) | 96.83 | flat |
| S&P 500 Futures | 6,943.75 | −0.13% |
| VIX | 18.58 | −14.65% |
| US 10Y Yield | ~4.05% | — |
| Gold Futures (COMEX) | $5,039.30 | +1.19% |
| Gold/Silver Ratio | 65.63 | ▲ from 65.0 |
| Gold 52-Week Range | $2,832 – $5,595 | −12.1% from ATH |
| Silver 52-Week Range | $28.16 – $121.67 | −38.4% from ATH |
\n
\n
\n
\n

\n
\n
\n
\nMarket Commentary
\n
The precious metals complex is under heavy pressure this morning as the post-CPI recovery collapses. Gold opened at $4,993 and immediately failed to hold the psychologically critical $5,000 level, sliding $134 intraday to a low of $4,858.23 — breaching both the Tenkan-sen ($4,975) and pressing into the Ichimoku cloud ($4,887–$4,883) for the first time since the recovery began. Silver was hit even harder, plunging from an open of $76.33 to an intraday low of $72.74 before recovering to $74.94 (−2.15%). The gold-silver ratio widened to 65.6, confirming silver’s amplified downside beta.
This is part of The Rio Times’ daily coverage of precious metals markets and Latin American financial markets.
\n
The selloff is notable for what it isn’t: dollar-driven. The DXY is essentially flat at 96.83, remaining near its 4-year low. This suggests the move is driven by profit-taking and pre-FOMC positioning rather than a fundamental shift in the macro backdrop. US markets were closed yesterday for Presidents’ Day, leaving thin overnight liquidity during Asian and early European hours — conditions that consistently amplify precious metals moves in this high-volatility regime.
\n
The context remains one of whipsaw exhaustion. Thursday’s NFP surprise (130K jobs, seven-month high) triggered a 3% gold selloff. Friday’s soft CPI (2.4% y/y, below 2.5% consensus; core 2.5%, softest in nearly 5 years) sparked a full recovery above $5,000. Now Tuesday’s session has erased that recovery entirely, with gold trading $80 below Friday’s close. Every bounce toward $5,040 has been sold, and every dip below $4,880 has been bought — creating a coiling range that is narrowing toward resolution.
\n
The VIX collapse to 18.58 (−14.65%) is a striking divergence: equity volatility is falling while metals volatility is rising. S&P 500 futures are only modestly lower (−0.13%), and COMEX gold futures are actually higher at $5,039 (+1.19%) — a rare spot-futures divergence that suggests physical selling is outpacing paper repositioning. PBoC gold purchases continue for a 15th consecutive month, and Shanghai Futures Exchange volumes remain elevated at 540 tonnes daily YTD. The structural demand picture hasn’t changed; it’s the tactical positioning that’s driving today’s move.
\n
\n
\n
\n
\n
\n
\n
\n
\n
\nTechnical Analysis
\n
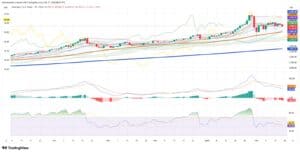
Gold (XAU/USD) — Daily (TradingView, Feb 17 08:01 UTC, FXCM): Today’s candle printed O: 4,992.94 / H: 5,000.12 / L: 4,858.23 / C: 4,918.34 (−74.60, −1.49%). This is a large bearish engulfing candle that completely reversed Friday’s CPI recovery. The high stalled precisely at $5,000 — confirming that level as overhead resistance. Price has now broken below the Tenkan-sen ($4,974.76) and is pressing into the Ichimoku cloud, with Senkou Span A at $4,887.02 and Span B at $4,883.48. A close below $4,883 would confirm a bearish cloud break. MACD remains positive (115.74 vs. signal 89.39) but the histogram has flipped to −26.35, the first negative reading in five sessions — signaling the bullish impulse from the CPI has been fully extinguished. RSI at 56.74 has rolled over sharply from Friday’s 59.51, still above 50 but heading lower with conviction.
\n
Silver (XAG/USD) — Daily (TradingView, Feb 17 08:01 UTC, Capital.com): Today’s candle printed O: 76.330 / H: 76.852 / L: 72.737 / C: 74.935 (−1.646, −2.15%). This is a devastating session with a $4.12 intraday range — the widest since the February 6 capitulation. The $72.74 low sliced through the Kijun-sen ($77.20) and Tenkan-sen ($77.92), penetrating the lower edge of the Ichimoku cloud. MACD is barely positive at 0.167 against a signal of −2.247, with the histogram at −2.414 — deeply negative and worsening. RSI at 47.98 has broken below the 50 neutral line for the first time since the recovery began, with the signal at 43.47 confirming weakening momentum. The 200-SMA at $51.63 remains far below, but the Bollinger midline at $61.17 is now a realistic downside target if selling accelerates.
\n
\n
\n
\n
| Level | Gold (XAU) | Silver (XAG) | Source |
|---|---|---|---|
| Resistance 3 | $5,108 | $85.02 | 61.8% Fib / prior range high |
| Resistance 2 | $5,000 | $77.92 | Psychological / Tenkan-sen |
| Resistance 1 | $4,975 | $76.92 | Tenkan-sen / Friday close |
| Spot | $4,918 | $74.94 | Feb 17 08:01 UTC |
| Support 1 | $4,883 | $72.74 | Ichimoku cloud base / session low |
| Support 2 | $4,858 | $70.00 | Intraday low / psychological |
| Support 3 | $3,883 | $51.63 | 200-day SMA |
\n
\n
\n
\nForward Look
\n
FOMC Minutes (today, Feb 18): The highest-conviction catalyst of the week arrives with metals already on the back foot. The January meeting minutes could reignite rate-cut repricing. Markets are pricing ~10% odds of a 25bp cut at the March 17–18 meeting, with two full cuts expected by year-end. A dovish tone acknowledging the disinflation progress in the CPI (2.4% y/y headline, 2.5% core) could spark a sharp reversal back above $5,000. Hawkish surprises — particularly any language about patience on cuts — risk pushing gold below the $4,883 cloud base and silver below $72.
\n
Live Market IntelligenceCommodities — Live Market Board
Rio Times · Live Market Intelligence
Commodities — Live Market Board
-0.03%
| Instrument | Last | Change | YoY | Prev. | High | Low | Volume |
|---|---|---|---|---|---|---|---|
| GOLD | 4,461 | +1.78% | +33.20% | 4,383 | 4,503 | 4,421 | 139,824 |
| SILVER | 65.59 | +1.26% | +73.05% | 64.77 | 66.98 | 64.81 | 46,406 |
| BRENT | 88.88 | -0.03% | +34.42% | 88.91 | 90.07 | 88.12 | 29,713 |
| WTI | 83.11 | -0.11% | +31.57% | 83.20 | 84.35 | 82.40 | 166,848 |
| COPPER | 6.61 | +0.03% | +46.70% | 6.61 | 6.71 | 6.61 | 39,543 |
| LITHIUM | 75.20 | +1.47% | +62.95% | 74.11 | 75.80 | 75.08 | 89,275 |
| IRON ORE | 161.91 | — | +58.10% | 161.91 | 161.91 | 1 | |
| SOY | 1,184 | +3.20% | +17.05% | 1,148 | 1,199 | 1,168 | 163,179 |
| CORN | 480.50 | +10.02% | +29.34% | 436.75 | 480.75 | 459.50 | 341,248 |
| WHEAT | 655.00 | +3.93% | +29.70% | 630.25 | 657.75 | 631.50 | 128,793 |
| COFFEE | 317.25 | -5.51% | +0.67% | 335.75 | 321.20 | 313.55 | 21,747 |
| SUGAR | 16.43 | -1.79% | -3.01% | 16.73 | 17.11 | 16.22 | 171,992 |
| COCOA | 5,719 | +3.18% | -34.96% | 5,543 | 5,779 | 5,574 | 26,773 |
| ORANGE JUICE | 138.55 | -0.47% | -45.38% | 139.20 | 141.05 | 137.50 | 703 |
| COTTON | 85.03 | +2.33% | +26.78% | 83.09 | 82.90 | 81.96 | 16,546 |
| BEEF | 223.60 | -3.93% | -5.18% | 232.75 | 226.40 | 223.00 | 16,126 |
| CATTLE | 339.10 | -3.16% | -1.82% | 350.17 | 345.50 | 338.60 | 10,164 |
| USD/BRL | 5.16 | +0.01% | -5.13% | 5.16 | 5.18 | 5.14 | — |
Data gauntlet (Wed–Thu): Initial jobless claims on Wednesday (last print 227K, above 222K estimate) — continued labor market softness would reinforce the rate-cut narrative and provide a fundamental bid for bullion. Thursday brings Q4 GDP data and February Manufacturing & Services PMI. Weak growth readings could accelerate the timeline for Fed easing.
\n
Cross-asset divergence: The VIX collapse to 18.58 while metals sell off is unusual. Equity markets don’t share precious metals’ anxiety — S&P futures are nearly flat, and COMEX gold futures are actually higher at $5,039. This spot-futures divergence suggests physical selling outpacing paper repositioning, which historically resolves with either a spot rally to converge or futures selling to catch down.
\n
Institutional consensus unchanged: JPMorgan targets Q4 2026 average $5,055/oz, Goldman Sachs forecasts $4,900 by Dec 2026, Wells Fargo lifted year-end to $6,100–$6,300, Deutsche Bank reiterated $6,000/oz. Central bank demand is projected at ~585 tonnes/quarter (JPM), with PBoC buying for 15 consecutive months. The medium-term thesis remains intact — today’s selloff is a tactical correction within a structural bull market.
\n
\n
\n
\n
\n
Key Facts
— Gold breaks below $5,000 and tests the Ichimoku cloud — FOMC minutes today will determine if this is a dip or a breakdown.
— The post-crash consolidation range is fracturing. Gold’s failure to hold $5,000 and silver’s breach of $75 represent the most bearish technical developments since the February 6 capitulation. The MACD histogram flipping negative for gold (−26.35) and deepening for silver (−2.414) confirms the CPI rally has been fully exhausted. However, three factors argue against chasing the downside here: (1) the DXY is flat, meaning there is no dollar tailwind to sustain the selloff; (2) COMEX futures are higher at $5,039, suggesting paper positioning is more constructive than spot; and (3) central bank structural demand (PBoC 15th consecutive month, 540 tonnes/day on SHFE) provides a medium-term floor. The Ichimoku cloud at $4,883 is the line in the sand. A daily close above it keeps the bull case alive with a retest of $5,000 on any dovish FOMC signal. A close below it opens the door to $4,650 — the lower Bollinger zone and a full retracement of the post-crash recovery. Silver’s RSI below 50 (47.98) is the more concerning signal, as it historically leads gold’s momentum turns by 1–2 sessions. Technical bias: Bearish on the daily; Neutral below $5,000, turning Bullish only on a daily close above $5,040 with FOMC confirmation.
\n
Related coverage: Brazil’s Ibovespa | Brazil’s Morning Call
This article was produced by The Rio Times’ automated newsroom system. How we use AI · Report an error · Editorial responsibility: Matthias Camenzind, Editor-in-Chief
Read More from The Rio Times