IBOV 179,722.48 ▲ 1.30% IPSA 11,315.26 ▼ 1.14% IPC MEX 65,314.78 ▼ 0.18% MERVAL 3,049,455 ▲ 0.51% COLCAP 2,470.26 ▲ 1.86% BVL PERÚ 59,450.29 ▲ 0.11% USD/BRL5.15▼ 0.62% USD/MXN16.98▼ 0.11% USD/CLP936.45▲ 0.24% USD/COP3,155▼ 1.44% USD/PEN3.36▼ 0.16% USD/ARS1,513▲ 0.25% USD/UYU40.24▲ 0.68% USD/PYG5,873▲ 0.47% USD/BOB12.08▲ 3.98% USD/DOP58.56▲ 0.38% USD/CRC446.47▲ 1.09% USD/GTQ7.62▲ 1.63% USD/HNL26.84▲ 1.11% USD/NIO36.62▲ 0.14% USD/VES796.33▼ 0.13% USD/PAB1.00— 0.00% USD/BZD2.00— 0.00% USD/JMD 157.28 — 0.00% USD/TTD6.69▼ 0.06% EUR/BRL5.97▼ 0.65% BRENT 88.88 ▼ 0.03% WTI 83.11 ▼ 0.11% IRON ORE 161.91 — — COPPER 6.61 ▲ 0.03% GOLD 4,461 ▲ 1.78% SILVER 65.59 ▲ 1.26% SOY 1,184 ▲ 3.20% CORN 480.50 ▲ 10.02% WHEAT 655.00 ▲ 3.93% COFFEE 317.25 ▼ 5.51% SUGAR 16.43 ▼ 1.79% ORANGE JUICE 138.55 ▼ 0.47% COTTON 85.03 ▲ 2.33% COCOA 5,719 ▲ 3.18% BEEF 223.60 ▼ 3.93% CATTLE 339.10 ▼ 3.16% LITHIUM 75.20 ▲ 1.47% PETR4 41.64 ▼ 0.05% VALE3 72.97 ▲ 0.83% ITUB4 38.60 ▼ 1.03% BBDC4 16.85 ▲ 0.36% ABEV3 14.89 ▼ 0.80% BBAS3 19.37 ▲ 0.47% B3SA3 14.26 ▼ 0.21% WEGE3 47.59 ▲ 0.49% PRIO3 59.14 ▼ 0.19% SUZB3 41.33 ▲ 2.35% RENT3 34.68 ▼ 0.09% AZZA3 15.89 ▼ 2.63% CSAN3 3.22 ▼ 1.83% RAIZ4 0.25 — 0.00% PCAR3 2.75 ▼ 0.36% GMAT3 3.65 ▼ 1.08% PSSA3 48.13 ▼ 0.54% CVCB3 1.33 ▼ 2.92% POSI3 3.36 ▲ 2.44% SLCE3 13.34 ▲ 0.30% NATU3 8.14 ▼ 0.73% IBOV 179,722.48 ▲ 1.30% IPSA 11,315.26 ▼ 1.14% IPC MEX 65,314.78 ▼ 0.18% MERVAL 3,049,455 ▲ 0.51% COLCAP 2,470.26 ▲ 1.86% BVL PERÚ 59,450.29 ▲ 0.11% USD/BRL 5.16 ▲ 0.01% USD/MXN 17.06 ▼ 0.24% USD/CLP 913.98 ▲ 0.04% USD/COP 3,140 ▲ 0.03% USD/PEN 3.36 ▼ 0.66% USD/ARS 1,493 ▲ 0.10% USD/UYU 40.27 ▲ 1.24% USD/PYG 5,939 ▲ 1.68% USD/BOB 11.64 ▼ 0.76% USD/DOP 58.34 ▲ 1.25% USD/CRC 445.92 ▲ 0.89% USD/GTQ 7.62 ▲ 2.21% USD/HNL 26.79 ▲ 1.57% USD/NIO 36.62 ▲ 0.69% USD/VES 762.44 ▼ 0.13% USD/PAB 1.00 — 0.00% USD/BZD 2.00 — 0.00% USD/JMD 157.28 — 0.00% USD/TTD 6.70 ▲ 0.61% EUR/BRL 5.95 ▲ 1.01% BRENT 88.88 ▼ 0.03% WTI 83.11 ▼ 0.11% IRON ORE 161.91 — — COPPER 6.61 ▲ 0.03% GOLD 4,461 ▲ 1.78% SILVER 65.59 ▲ 1.26% SOY 1,184 ▲ 3.20% CORN 480.50 ▲ 10.02% WHEAT 655.00 ▲ 3.93% COFFEE 317.25 ▼ 5.51% SUGAR 16.43 ▼ 1.79% ORANGE JUICE 138.55 ▼ 0.47% COTTON 85.03 ▲ 2.33% COCOA 5,719 ▲ 3.18% BEEF 223.60 ▼ 3.93% CATTLE 339.10 ▼ 3.16% LITHIUM 75.20 ▲ 1.47% PETR4 41.64 ▼ 0.05% VALE3 72.97 ▲ 0.83% ITUB4 38.60 ▼ 1.03% BBDC4 16.85 ▲ 0.36% ABEV3 14.89 ▼ 0.80% BBAS3 19.37 ▲ 0.47% B3SA3 14.26 ▼ 0.21% WEGE3 47.59 ▲ 0.49% PRIO3 59.14 ▼ 0.19% SUZB3 41.33 ▲ 2.35% RENT3 34.68 ▼ 0.09% AZZA3 15.89 ▼ 2.63% CSAN3 3.22 ▼ 1.83% RAIZ4 0.25 — 0.00% PCAR3 2.75 ▼ 0.36% GMAT3 3.65 ▼ 1.08% PSSA3 48.13 ▼ 0.54% CVCB3 1.33 ▼ 2.92% POSI3 3.36 ▲ 2.44% SLCE3 13.34 ▲ 0.30% NATU3 8.14 ▼ 0.73%
since 2009
Tuesday, September 1, 2026

Agri Business Business - Brazil

Global Soy and Corn Supply Tweaked in Latest USDA Insights

By · March 8, 2024 · 2 min read

Daily Brief

The morning intel from across Latin America. Free.

By subscribing you agree to our privacy policy. We never share your email.

The USDA recently updated its figures, slightly reducing Brazil’s soybean output to 155 million tons, down from an earlier estimate of 156 million tons.

This change is minimal, with market forecasts previously ranging between 148 and 156 million tons. The adjustment underscores the slight fluctuation in Brazil’s soybean yield.

Argentina’s soybean production remains predicted at 50 million tons, matching market expectations that varied from 50 to 52 million tons.

This stability indicates a consistent outlook for Argentina’s soybean market.

In the US, soybean stock levels and export figures stand firm at 8.57 million and 46.81 million tons, respectively.
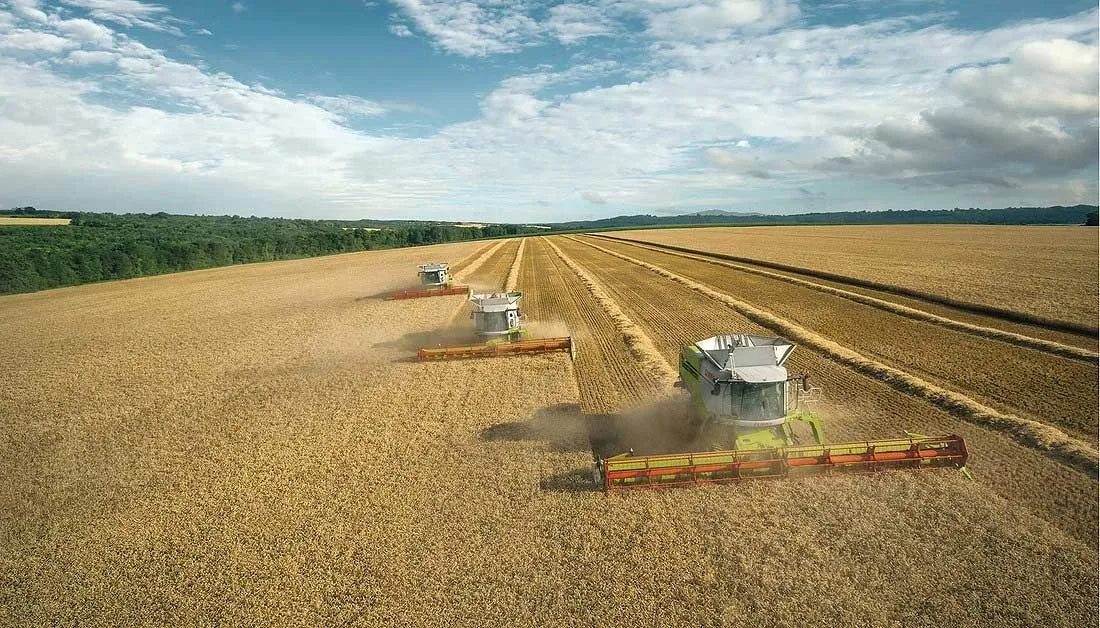
Global Soy and Corn Supply Tweaked in Latest USDA Insights
Global Soy and Corn Supply Tweaked in Latest USDA Insights. (Photo Internet reproduction)
One-stop reference
Company Intelligence
Every listed company in Latin America — financials, ownership and structure for 1,450+ companies across 26 exchanges, in one place.
Browse the directory →
RT
Ask Rio Times
Latin American markets, currencies and companies.
Open the full Ask Rio Times →

This steadiness contrasts with anticipated adjustments, highlighting the market’s resilience.

Worldwide, soybean production dipped slightly from 398.21 million to 396.85 million tons.

Consequently, global ending stocks also saw a reduction, moving from 116.03 million to 114.27 million tons. This global shift points to a slight tightening in the soybean supply.

Notably, the USDA raised its projection for China‘s soybean imports from 102 to 105 million tons. This significant increase reflects China’s growing demand for soybeans.

In the corn sector, minor adjustments were noted for South America. Brazil’s corn production estimate remains at 124 million tons, within the expected range.

Meanwhile, Argentina’s forecast increased slightly from 55 to 56 million tons, indicating a positive adjustment in its corn production.

Global Corn Production and Supply Dynamics

Global corn production saw a minor revision downward, from 1,232.57 billion to 1,230.24 billion tons, with ending stocks also decreasing. This global perspective suggests a slight shift in corn availability.

Ukraine’s corn production forecast dropped to 29.5 million tons, but the export outlook increased, highlighting resilience in international supply.

China’s corn import forecast remains unchanged at 23 million tons, indicating steady demand within the country.

For the US, corn stock estimates are consistent at 55.17 million tons, aligning with expectations and showcasing stability in the US corn market.

The USDA report links agricultural forecast changes to global supply and demand dynamics, which is crucial for market participants worldwide.

This article was produced by The Rio Times’ automated newsroom system. How we use AI · Report an error

Read More from The Rio Times

The Rio Times · Power Map
See who really holds power in Latin America
Click to open the Power Map

Rotate for Best Experience

This report is optimized for landscape viewing. Rotate your phone for the full experience.