China’s export growth in July 2024 was weaker than expected. This reflects global economic uncertainties, geopolitical tensions, and shifting consumer sentiment.
Despite challenges, a surprising uptick in imports suggests a potential recovery in domestic demand. The burgeoning electric vehicle (EV) sector drives this recovery.
Export Performance and Challenges
In July 2024, China’s exports grew by 7% year-on-year to $300.56 billion. Analysts expected 9.5% growth, but it fell short.
The growth was also lower than June’s 8.6% increase. Several factors contributed to this underperformance:
Global Economic Uncertainties: Declining manufacturing PMIs in developed markets indicated weaker final demand.
Concerns about a potential U.S. recession triggered a global stock market sell-off. This further dampened consumer confidence.
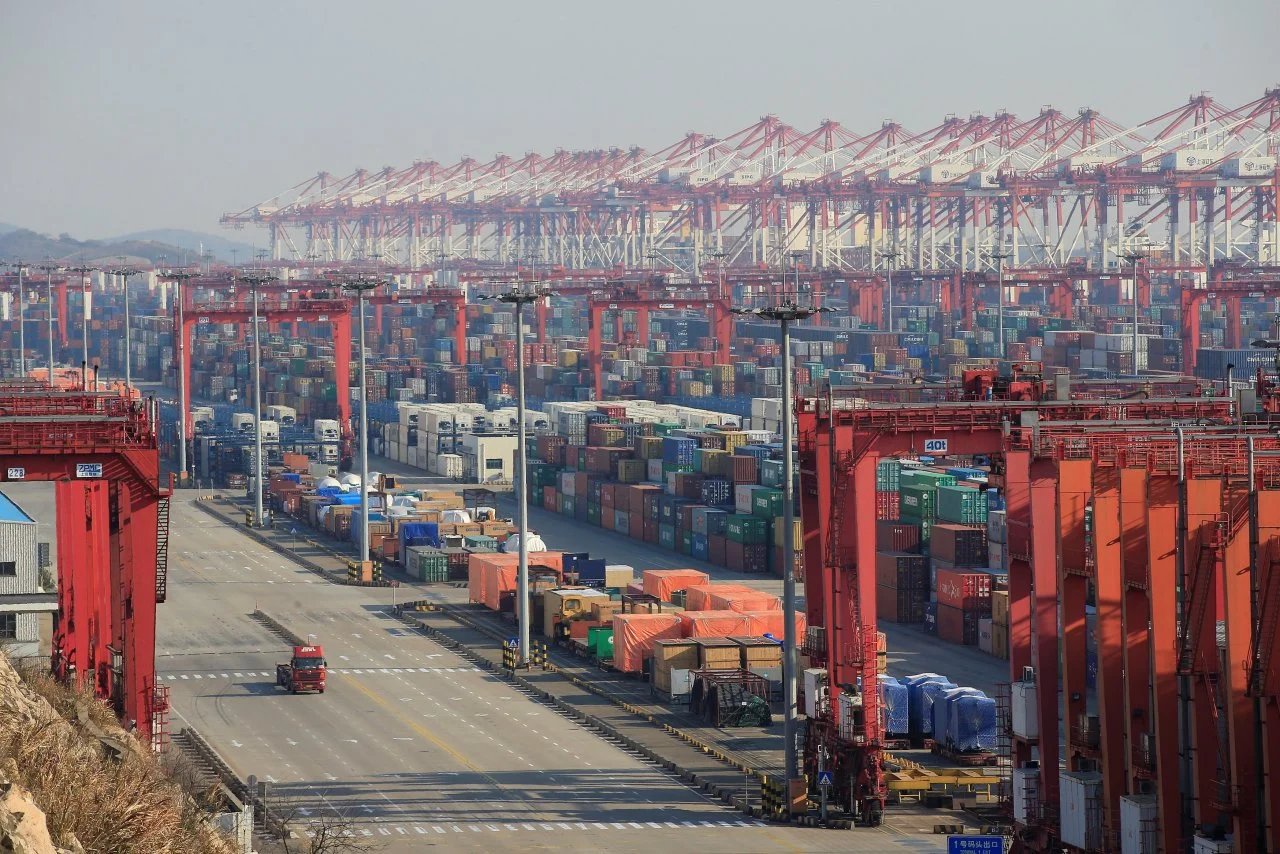
Geopolitical Tensions: Additional tariffs by the U.S. and the European Union created headwinds for Chinese exports.
The U.S. delayed tariffs on over 100 Chinese goods. However, the European Union’s decision on tariffs for Chinese EVs remains pending.
Currency Fluctuations: The yuan’s appreciation added difficulty for exporters. This could potentially make Chinese goods more expensive globally.
The Urgency of Domestic Demand
Gary Ng, a senior economist at Natixis Corporate and Investment Bank, highlighted the urgency for China to pivot towards demand-side policies. Relying on exports as a growth engine appears increasingly precarious.
The global economic landscape necessitates a shift towards bolstering domestic demand. This could provide a more stable foundation for economic growth.
Import Growth: A Silver Lining
Contrary to sluggish export growth, China‘s imports in July 2024 exceeded expectations. Imports rose by 7.2% year-on-year. This marked a significant rebound from June’s 2.3% decrease.
It also marked a rebound from the 12.4% decline in the same month the previous year. Analysts attribute this import growth to several factors:
Electric Vehicle Sector: The EV sector significantly drove import demand. Components such as copper and car parts saw increased demand. This sector’s growth underscores China’s technological advancements and manufacturing upgrades.
Hi-Tech Imports: There has been robust demand for high-tech imports. These include semiconductors and automatic data processing equipment. This demand is driven by China’s push for technological self-sufficiency.
Fiscal Support: Increased fiscal support is expected to boost import-intensive construction activities. This contributes to overall import growth.
Trade Surplus and Global Trade Dynamics
China’s trade surplus in July 2024 stood at $84.65 billion. This was down from a record $99.05 billion in June. The rise in imports partly caused this decline.
While reducing the trade surplus, indicates strengthening domestic demand. Analysts view this trend positively. It aligns with China’s strategic goal of boosting domestic consumption.
Regional and Product-Specific Trends
China’s trade with various regions and specific products showed mixed results:
Regional Trade: Exports to the Association of Southeast Asian Nations (ASEAN) rose by 12.15% year-on-year. Exports to Russia decreased by 2.81%.
Shipments to the U.S. and the European Union increased by 8% and 7.9%, respectively. This indicates continued demand for Chinese goods despite geopolitical tensions.
Product-Specific Trends: Car shipments surged by 26.26% in volume and 13.81% in value. Ship exports saw significant growth, increasing by 21.93% in volume and 54.8% in value.
Integrated circuits, critical for various industries, saw a 51.39% increase in volume and a 27.67% increase in value.
Conclusion
China’s trade dynamics in July 2024 reflect a nuanced picture. Exports face significant headwinds from global economic uncertainties and geopolitical tensions.
However, the unexpected rise in imports offers hope for recovering domestic demand. This dual narrative underscores the importance of rebalancing China’s growth strategy.
Focusing on domestic consumption can mitigate external risks and sustain long-term economic stability.
This article was produced by The Rio Times’ automated newsroom system. How we use AI · Report an error · Editorial responsibility: Matthias Camenzind, Editor-in-Chief