IBOV 175,664.62 ▲ 0.30% IPSA 11,445.90 ▼ 0.22% IPC MEX 65,484.32 ▼ 0.53% MERVAL 2,979,472 ▼ 0.72% COLCAP 2,457.87 ▼ 1.28% BVL PERÚ 60,779.49 ▼ 1.40% USD/BRL5.21▲ 0.25% USD/MXN17.01▼ 0.17% USD/CLP930.10▼ 0.15% USD/COP3,203▲ 0.08% USD/PEN3.36▲ 0.38% USD/ARS1,512▼ 0.03% USD/UYU40.27— 0.00% USD/PYG5,900— 0.00% USD/BOB11.78— 0.00% USD/DOP58.75▲ 0.24% USD/CRC446.65— 0.00% USD/GTQ7.62— 0.00% USD/HNL26.84— 0.00% USD/NIO36.62— 0.00% USD/VES793.00▼ 0.13% USD/PAB1.00— 0.00% USD/BZD2.00— 0.00% USD/JMD 157.28 — 0.00% USD/TTD6.72— 0.00% EUR/BRL6.04▲ 0.17% BRENT 88.88 ▼ 0.03% WTI 83.11 ▼ 0.11% IRON ORE 161.91 — — COPPER 6.61 ▲ 0.03% GOLD 4,461 ▲ 1.78% SILVER 65.59 ▲ 1.26% SOY 1,184 ▲ 3.20% CORN 480.50 ▲ 10.02% WHEAT 655.00 ▲ 3.93% COFFEE 317.25 ▼ 5.51% SUGAR 16.43 ▼ 1.79% ORANGE JUICE 138.55 ▼ 0.47% COTTON 85.03 ▲ 2.33% COCOA 5,719 ▲ 3.18% BEEF 223.60 ▼ 3.93% CATTLE 339.10 ▼ 3.16% LITHIUM 75.20 ▲ 1.47% PETR4 41.64 ▼ 0.05% VALE3 72.97 ▲ 0.83% ITUB4 38.60 ▼ 1.03% BBDC4 16.85 ▲ 0.36% ABEV3 14.89 ▼ 0.80% BBAS3 19.37 ▲ 0.47% B3SA3 14.26 ▼ 0.21% WEGE3 47.59 ▲ 0.49% PRIO3 59.14 ▼ 0.19% SUZB3 41.33 ▲ 2.35% RENT3 34.68 ▼ 0.09% AZZA3 15.89 ▼ 2.63% CSAN3 3.22 ▼ 1.83% RAIZ4 0.25 — 0.00% PCAR3 2.75 ▼ 0.36% GMAT3 3.65 ▼ 1.08% PSSA3 48.13 ▼ 0.54% CVCB3 1.33 ▼ 2.92% POSI3 3.36 ▲ 2.44% SLCE3 13.34 ▲ 0.30% NATU3 8.14 ▼ 0.73% IBOV 175,664.62 ▲ 0.30% IPSA 11,445.90 ▼ 0.22% IPC MEX 65,484.32 ▼ 0.53% MERVAL 2,979,472 ▼ 0.72% COLCAP 2,457.87 ▼ 1.28% BVL PERÚ 60,779.49 ▼ 1.40% USD/BRL 5.16 ▲ 0.01% USD/MXN 17.06 ▼ 0.24% USD/CLP 913.98 ▲ 0.04% USD/COP 3,140 ▲ 0.03% USD/PEN 3.36 ▼ 0.66% USD/ARS 1,493 ▲ 0.10% USD/UYU 40.27 ▲ 1.24% USD/PYG 5,939 ▲ 1.68% USD/BOB 11.64 ▼ 0.76% USD/DOP 58.34 ▲ 1.25% USD/CRC 445.92 ▲ 0.89% USD/GTQ 7.62 ▲ 2.21% USD/HNL 26.79 ▲ 1.57% USD/NIO 36.62 ▲ 0.69% USD/VES 762.44 ▼ 0.13% USD/PAB 1.00 — 0.00% USD/BZD 2.00 — 0.00% USD/JMD 157.28 — 0.00% USD/TTD 6.70 ▲ 0.61% EUR/BRL 5.95 ▲ 1.01% BRENT 88.88 ▼ 0.03% WTI 83.11 ▼ 0.11% IRON ORE 161.91 — — COPPER 6.61 ▲ 0.03% GOLD 4,461 ▲ 1.78% SILVER 65.59 ▲ 1.26% SOY 1,184 ▲ 3.20% CORN 480.50 ▲ 10.02% WHEAT 655.00 ▲ 3.93% COFFEE 317.25 ▼ 5.51% SUGAR 16.43 ▼ 1.79% ORANGE JUICE 138.55 ▼ 0.47% COTTON 85.03 ▲ 2.33% COCOA 5,719 ▲ 3.18% BEEF 223.60 ▼ 3.93% CATTLE 339.10 ▼ 3.16% LITHIUM 75.20 ▲ 1.47% PETR4 41.64 ▼ 0.05% VALE3 72.97 ▲ 0.83% ITUB4 38.60 ▼ 1.03% BBDC4 16.85 ▲ 0.36% ABEV3 14.89 ▼ 0.80% BBAS3 19.37 ▲ 0.47% B3SA3 14.26 ▼ 0.21% WEGE3 47.59 ▲ 0.49% PRIO3 59.14 ▼ 0.19% SUZB3 41.33 ▲ 2.35% RENT3 34.68 ▼ 0.09% AZZA3 15.89 ▼ 2.63% CSAN3 3.22 ▼ 1.83% RAIZ4 0.25 — 0.00% PCAR3 2.75 ▼ 0.36% GMAT3 3.65 ▼ 1.08% PSSA3 48.13 ▼ 0.54% CVCB3 1.33 ▼ 2.92% POSI3 3.36 ▲ 2.44% SLCE3 13.34 ▲ 0.30% NATU3 8.14 ▼ 0.73%
since 2009
Monday, August 31, 2026

Brazil Business - Brazil

Brazil’s Tax Burden: Highest in Latin America, Lowest in Returns

By · December 27, 2024 · 2 min read

Daily Brief

The morning intel from across Latin America. Free.

By subscribing you agree to our privacy policy. We never share your email.

(Analysis) Brazil’s tax system stands as a complex puzzle, simultaneously funding social programs and hindering economic growth. At 33.3% of GDP, Brazil’s tax burden towers above its Latin American peers, rivaling developed OECD nations.

This high rate, however, masks a deeper issue: the mismatch between tax collection and public service delivery. Despite its substantial tax revenues, Brazil ranks last in welfare return among the 30 highest-taxed countries.

This paradox raises critical questions about fiscal efficiency and social equity. The system disproportionately affects lower-income individuals through regressive indirect taxes, while the wealthiest 0.01% often pay effective rates comparable to middle-income earners.

Brazil’s tax structure covers a broad spectrum, from income and profits to goods and services. Notably, taxes on goods and services alone account for 13.7% of GDP, surpassing both regional and OECD averages.

This heavy reliance on consumption taxes exacerbates income inequality. The country’s tax burden has grown significantly since 1990, primarily due to increased taxation on income and profits.
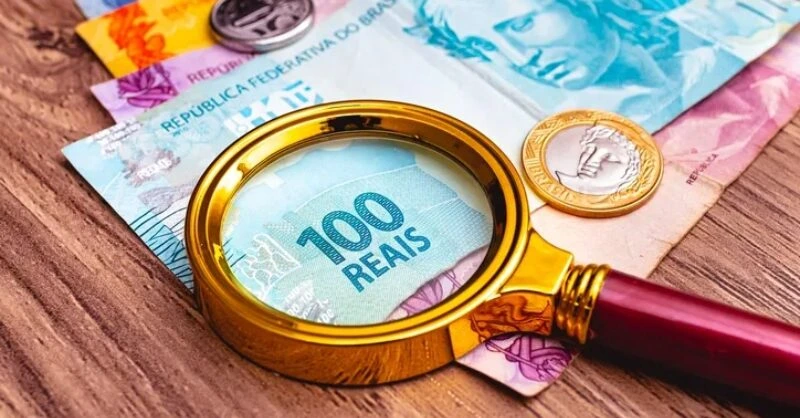
Brazil's Tax Burden: Highest in Latin America, Lowest in Returns
Brazil’s Tax Burden: Highest in Latin America, Lowest in Returns. (Photo Internet reproduction)
One-stop reference
Company Intelligence
Every listed company in Latin America — financials, ownership and structure for 1,450+ companies across 26 exchanges, in one place.
Browse the directory →
RT
Ask Rio Times
Latin American markets, currencies and companies.
Open the full Ask Rio Times →

While this growth aligns with extensive social spending, comprising about 60% of the tax burden, it fails to translate into commensurate improvements in public services or living standards.

Experts propose various solutions to this fiscal conundrum. Some advocate for maintaining revenue levels while lowering tax rates by reducing benefits and combating tax evasion.

Others suggest a fundamental restructuring, shifting the burden from consumption to income and wealth taxes. This tax system overhaul could potentially address both fiscal and social inequalities.

By reducing consumption taxes and increasing levies on high earners, Brazil might fund expanded public services more equitably. Such reforms could transform Brazil’s tax system from a burden into a tool for inclusive economic growth and social development.

This article was produced by The Rio Times’ automated newsroom system. How we use AI · Report an error

Read More from The Rio Times

The Rio Times · Power Map
See who really holds power in Latin America
Click to open the Power Map

Rotate for Best Experience

This report is optimized for landscape viewing. Rotate your phone for the full experience.