Brazil’s Soybean Boom Slows to Its Weakest Pace in 20 Years
Commodities
Key Facts
The Brazil soybean area will hit a new record next season, yet the increase is the smallest in twenty years, a sign that the country’s great expansion engine is finally running out of easy fuel.
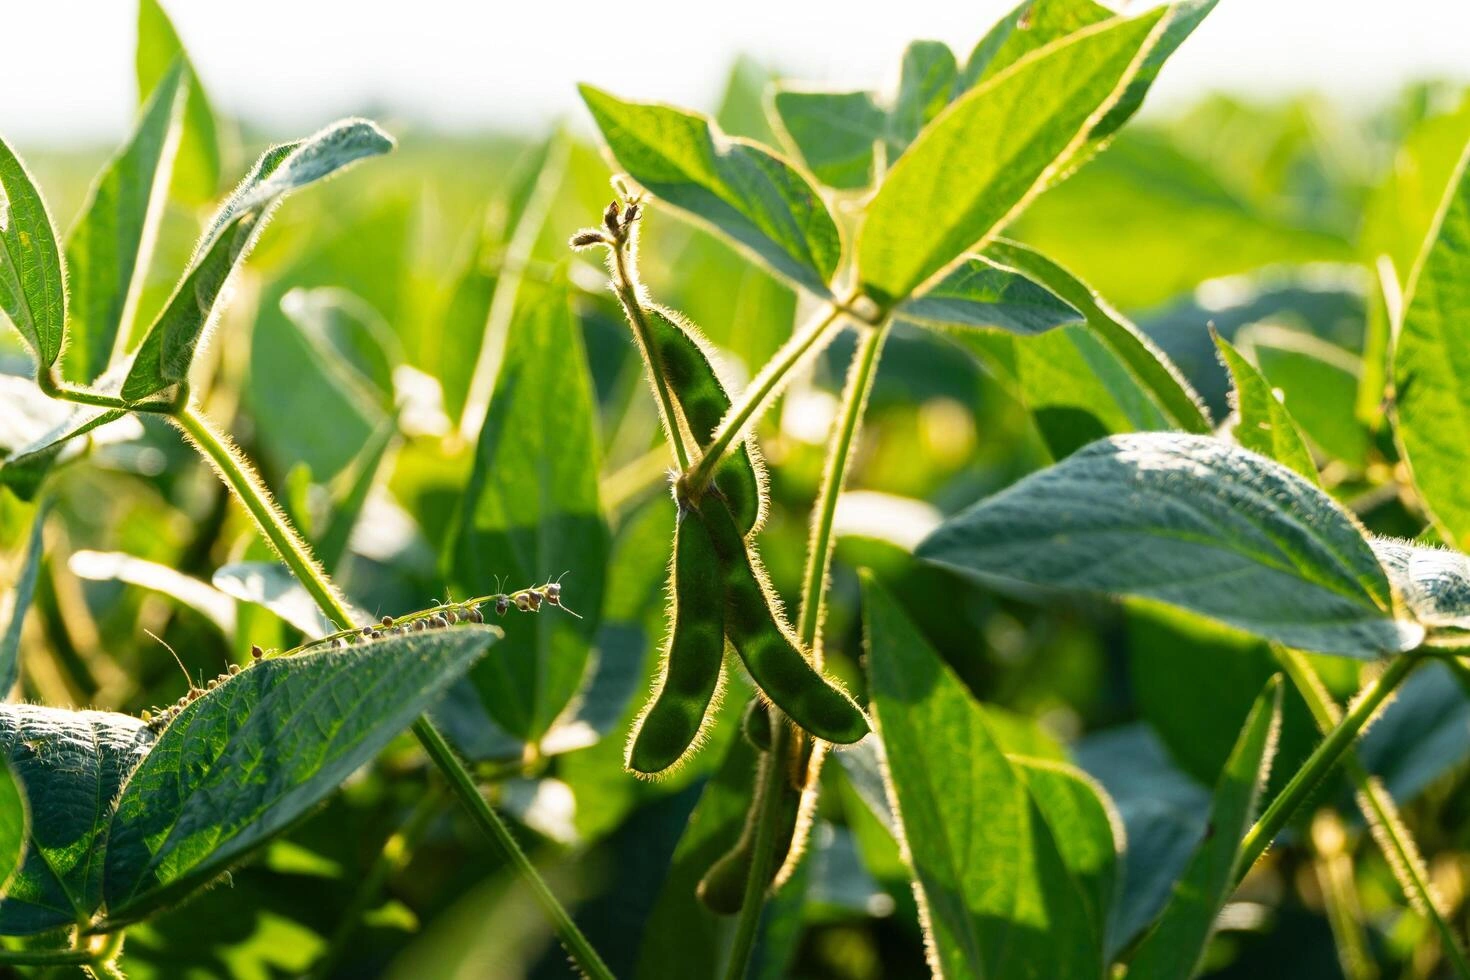
For two decades, Brazil’s soybean fields have done one thing reliably: grow. Every year the planted area has climbed, turning the country into the world’s dominant supplier.
That run is not ending, but it is slowing sharply. The next harvest will set another record for land, while expanding at the weakest pace in a generation.
What the Brazil soybean area numbers show
The consultancy AgRural expects farmers to plant a record area of soybeans in the 2026/27 season. In round terms, that is forty-nine million hectares, an area larger than Sweden.
But the rise over the previous year is just under one percent, roughly four hundred thousand hectares. That is the smallest annual increase in twenty years.
The headline still reads “record,” because the streak of consecutive yearly gains remains intact. Yet the momentum behind it has clearly faded.
For years that expansion barely paused, pushing the soy frontier deep into Brazil’s interior. A near-flat reading is therefore a meaningful shift, not a rounding error.
Why growers are easing off
The reason is money. AgRural points to a squeeze on grower profits, driven by higher production costs while soybean prices have stayed flat.
Credit has also tightened. Farmers are carrying more debt, and lenders have grown more cautious about the countryside after a run of financial stress.
This echoes a warning that has been building for months. Brazil’s farm lobby has flagged rising rural loan defaults and shrinking margins as the quiet risk beneath record harvests.
Weather adds another layer of caution. A developing El Niño could bring helpful early rain to the centre-west but threatens longer dry spells further north.
Live Market IntelligenceBrazil — Live Market Board
Rio Times · Live Market Intelligence
Brazil — Live Market Board
+0.46%
183,827.59
+0.46%
65,071.30
+0.20%
11,055.91
-0.73%
2,782,561
-0.59%
2,558.92
-0.79%
60,220.45
+0.32%
| Instrument | Last | Change | YoY | Prev. | High | Low | Volume |
|---|---|---|---|---|---|---|---|
| IBOV | 183,827.59 | +0.46% | +21.85% | 182,991.13 | 168,310 | 167,142 | — |
| USD/BRL | 5.16 | +0.01% | -5.13% | 5.16 | 5.18 | 5.14 | — |
| SELIC | 14.00% | — | — | — | — | — | |
| PETR4 | 41.64 | -0.05% | +35.19% | 41.66 | 41.97 | 41.15 | 41,499,400 |
| VALE3 | 72.97 | +0.83% | +30.75% | 72.37 | 73.54 | 72.66 | 17,658,000 |
| ITUB4 | 38.60 | -1.03% | +4.57% | 39.00 | 39.34 | 38.39 | 29,487,800 |
| BBDC4 | 16.85 | +0.36% | +3.50% | 16.79 | 16.90 | 16.67 | 19,416,900 |
| BBAS3 | 19.37 | +0.47% | +0.73% | 19.28 | 19.44 | 19.16 | 11,069,200 |
| B3SA3 | 14.26 | -0.21% | +12.73% | 14.29 | 14.47 | 14.11 | 33,037,800 |
| ABEV3 | 14.89 | -0.80% | +21.91% | 15.01 | 15.07 | 14.81 | 16,453,100 |
| WEGE3 | 47.59 | +0.49% | +29.99% | 47.36 | 48.08 | 47.36 | 3,364,600 |
| PRIO3 | 59.14 | -0.19% | +50.67% | 59.25 | 59.81 | 58.74 | 3,325,600 |
| SUZB3 | 41.33 | +2.35% | -23.55% | 40.38 | 41.48 | 40.35 | 3,914,900 |
| RENT3 | 34.68 | -0.09% | +0.84% | 34.71 | 34.96 | 34.35 | 7,979,100 |
| AZZA3 | 15.89 | -2.63% | -53.76% | 16.32 | 16.42 | 15.82 | 1,330,300 |
| CSNA3 | 4.30 | +0.47% | -42.65% | 4.28 | 4.41 | 4.26 | 10,076,100 |
| GGBR4 | 24.69 | +2.19% | +51.38% | 24.16 | 24.85 | 24.18 | 7,047,600 |
| ENEV3 | 24.21 | -1.38% | +70.49% | 24.55 | 24.64 | 23.99 | 9,297,000 |
Why the world is watching
This is not a local farming story. Brazil is the world’s largest soybean exporter, and its crop helps feed livestock and fuel bioenergy across continents.
It is also China’s indispensable supplier. Brazil provided close to three-quarters of China’s soybean imports last year, a dependence deepened by the trade war between Beijing and Washington.
That dominance grew as China effectively stopped buying American soybeans through much of last year. Private Chinese buyers also favour Brazilian beans because a lower import tariff makes them cheaper than the United States supply.
Demand at home is rising too. Brazil keeps lifting the share of soy-based biodiesel blended into its diesel, which pulls more of the crop into the fuel tank rather than onto export ships.
When the engine of global soy supply slows its expansion, the effects ripple outward. Tighter future growth in acreage can firm prices for animal feed and cooking oil far from Brazil.
For now the immediate picture is still one of abundance, with another record crop on the way. The signal in this forecast is about the cycles to come, not this one.
What it means for investors
The read is that Brazil’s soy supply is approaching a ceiling on how fast it can keep expanding by simply adding land. The cheap-growth phase is maturing.
Soybeans respond slowly, with planting decisions shaping output a year or more ahead. A stall in area today can quietly tighten the supply outlook for later seasons.
It also shifts attention from sheer acreage toward yield, costs and logistics as the levers of future growth. Producers will need to squeeze more from the same land.
For anyone tracking grain markets, the takeaway is a structurally tighter long-run picture, with Brazil’s margins, debt and weather now the variables that matter most.
Frequently Asked Questions
How big is the Brazil soybean area for 2026/27?
AgRural forecasts a record of just over forty-nine million hectares for the 2026/27 season, an area larger than Sweden. The increase over the prior year is under one percent, about four hundred thousand hectares, which is the smallest annual expansion in two decades.
Why is the expansion slowing?
Grower profits have been squeezed by higher costs while soybean prices stayed flat, and credit has tightened as farm debt rises. Producers are also cautious about a developing El Niño that could disrupt rainfall, all of which discourages the rapid land expansion seen in past years.
Why does this matter beyond Brazil?
Brazil is the world’s largest soybean exporter and supplies nearly three-quarters of China’s imports, so its planting decisions shape global supply. A slower pace of area growth points to a structurally tighter long-run market, which can firm prices for animal feed and cooking oil worldwide.
Connected Coverage
This article was produced by The Rio Times’ automated newsroom system. How we use AI · Report an error
Read More from The Rio Times