Brazil’s Copper Exports Jump 84 Percent, and Washington Cannot Touch Them
Markets
Key Facts
—Copper. Ore and concentrate exports reached $3.87bn in the first half of 2026, up 84% from $2.10bn, on trade ministry data.
—Iron ore. Shipments totalled $13.4bn, up 5.2%, at 189.4 million tonnes.
—The comparison. Those two ores alone came to $17.27bn — roughly what Brazil sold the entire United States in the same six months ($17.4bn).
—The exemption. Iron ore sits on the annex of goods carved out of the proposed 25% Section 301 tariff. Copper is excluded under separate metals tariffs.
—The buyer. China took about 77% of Brazil’s unagglomerated iron ore, spending $9.15bn.
—The surprise. China, not Germany, led copper purchases at $865.1m. India’s rose from $50.1m to $376.4m.
Brazil mineral exports had a very good six months, and the timing is worth sitting with: almost none of that trade is exposed to the tariff decision Washington must take today.
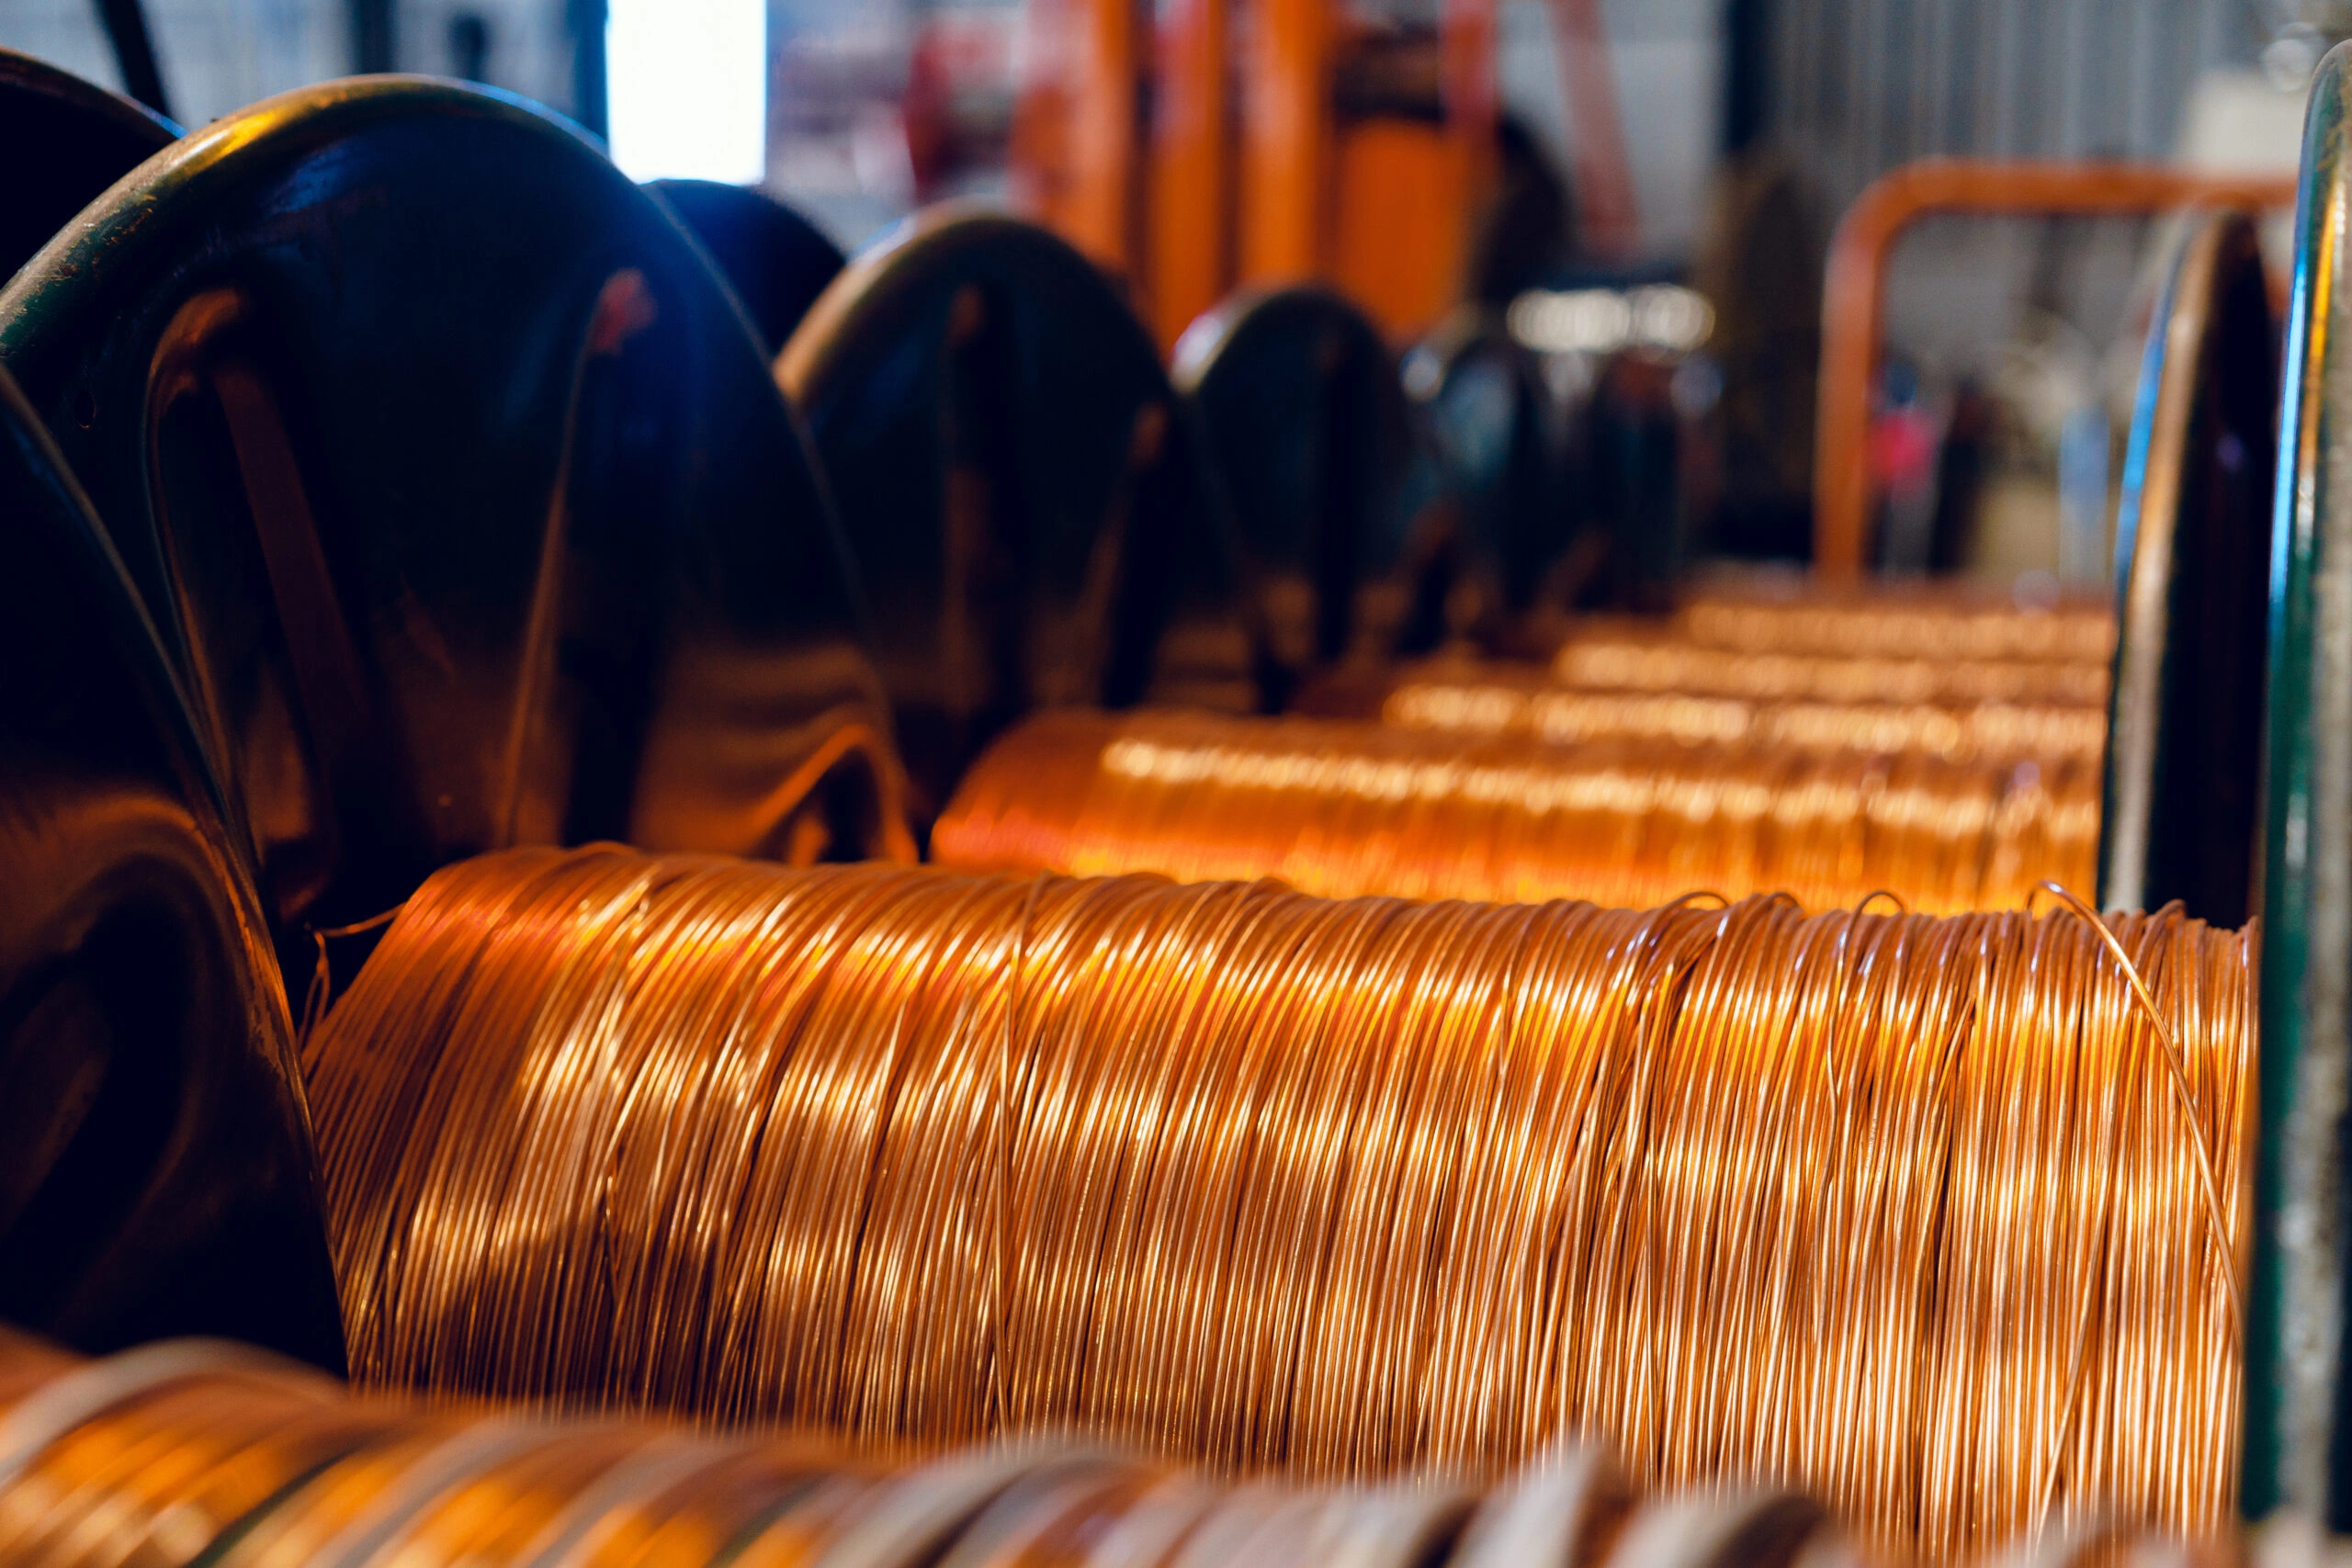
Iron ore and copper ore together earned Brazil about seventeen point three billion dollars in the first half. That is roughly what the country sold the entire American market over the same period.
One of those trades is under threat this afternoon. The other is not.
What the Brazil mineral exports data shows
The copper number is the headline. Exports of copper ore and concentrates reached three point eight seven billion dollars in the first half, against two point one billion a year earlier.
That is a rise of eighty-four percent in dollars. Volume rose thirty percent, from six hundred and fifty-two thousand tonnes to eight hundred and forty-eight and a half thousand.
The gap between those two figures is the interesting part. Strip volume out and the implied average price rose about forty-two percent, from roughly three thousand two hundred dollars a tonne to four thousand five hundred and sixty.
Iron ore tells a duller story. Shipments came to thirteen point four billion dollars, up five point two percent, on volume of a hundred and eighty-nine point four million tonnes.
Inside that figure sits one genuinely fast-growing line. Agglomerated ore — pellets, sinter, briquettes — rose twenty and a half percent in value and nearly twenty-three percent in volume, while the raw unagglomerated bulk crawled ahead at three point four percent.
The tariff the ore does not pay
Washington faces a statutory deadline today on whether to impose an additional twenty-five percent duty on Brazilian goods. The proposal published on June 1 carries an annex of more than sixteen hundred exempt tariff lines.
Iron ore is on that list. Copper is excluded by a different route, because goods already covered by American metals tariffs fall outside the proposed action.
So the two commodities that earned Brazil seventeen billion dollars in six months are, on the proposal as drafted, largely untouched. The tariff bites manufactured goods, and manufactured exports to the American market fell by more than a billion dollars over the same half-year.
That is the shape of the whole dispute in one comparison. Brazil’s commodity trade is insulated; its industrial trade is not.
Live Market IntelligenceBrazil — Live Market Board
Rio Times · Live Market Intelligence
Brazil — Live Market Board
-0.01%
185,188.13
-0.01%
65,473.16
+0.91%
11,315.26
-1.14%
3,058,093
-1.55%
2,534.46
+1.81%
59,719.97
+0.43%
| Instrument | Last | Change | YoY | Prev. | High | Low | Volume |
|---|---|---|---|---|---|---|---|
| IBOV | 185,188.13 | -0.01% | +21.85% | 185,205.09 | 168,310 | 167,142 | — |
| USD/BRL | 5.16 | +0.01% | -5.13% | 5.16 | 5.18 | 5.14 | — |
| SELIC | 14.00% | — | — | — | — | — | |
| PETR4 | 41.64 | -0.05% | +35.19% | 41.66 | 41.97 | 41.15 | 41,499,400 |
| VALE3 | 72.97 | +0.83% | +30.75% | 72.37 | 73.54 | 72.66 | 17,658,000 |
| ITUB4 | 38.60 | -1.03% | +4.57% | 39.00 | 39.34 | 38.39 | 29,487,800 |
| BBDC4 | 16.85 | +0.36% | +3.50% | 16.79 | 16.90 | 16.67 | 19,416,900 |
| BBAS3 | 19.37 | +0.47% | +0.73% | 19.28 | 19.44 | 19.16 | 11,069,200 |
| B3SA3 | 14.26 | -0.21% | +12.73% | 14.29 | 14.47 | 14.11 | 33,037,800 |
| ABEV3 | 14.89 | -0.80% | +21.91% | 15.01 | 15.07 | 14.81 | 16,453,100 |
| WEGE3 | 47.59 | +0.49% | +29.99% | 47.36 | 48.08 | 47.36 | 3,364,600 |
| PRIO3 | 59.14 | -0.19% | +50.67% | 59.25 | 59.81 | 58.74 | 3,325,600 |
| SUZB3 | 41.33 | +2.35% | -23.55% | 40.38 | 41.48 | 40.35 | 3,914,900 |
| RENT3 | 34.68 | -0.09% | +0.84% | 34.71 | 34.96 | 34.35 | 7,979,100 |
| AZZA3 | 15.89 | -2.63% | -53.76% | 16.32 | 16.42 | 15.82 | 1,330,300 |
| CSNA3 | 4.30 | +0.47% | -42.65% | 4.28 | 4.41 | 4.26 | 10,076,100 |
| GGBR4 | 24.69 | +2.19% | +51.38% | 24.16 | 24.85 | 24.18 | 7,047,600 |
| ENEV3 | 24.21 | -1.38% | +70.49% | 24.55 | 24.64 | 23.99 | 9,297,000 |
Germany bought more copper than China
The buyer list is where the copper story stops being about price. China led, taking eight hundred and sixty-five million dollars, more than double the three hundred and eighty-nine million of a year earlier.
Germany came second at seven hundred and twelve million. India went from fifty million to three hundred and seventy-six, a rise of more than seven times.
China and India together bought over a billion and a quarter, comfortably ahead of Germany. Poland and Sweden also rose.
Copper is the metal of electrification: transmission networks, cables, motors, electric vehicles, wind turbines, solar panels and storage. European and Indian buying is industrial policy showing up in customs data.
Iron ore is the mirror image. China alone bought nine point one five billion dollars of the unagglomerated grade, about seventy-seven percent of the total, up from eight point three seven billion.
Malaysia fell nineteen percent while Japan rose sixteen. The concentration risk is unchanged: Brazil’s largest single export line depends on Chinese steel mills.
Where the money is going next
The mining industry association projects seventy-six point nine billion dollars of sector investment between 2026 and 2030, twelve and a half percent above its previous estimate. Of that, twenty-one point three billion is earmarked for critical minerals.
Iron ore still takes the largest slice of planned spending at nearly twenty-six percent, with copper second at eleven. The pivot is real but gradual.
The dependence runs the other way too. Brazil imports the minerals it lacks, and potassium for fertiliser makes up half that bill, with the United States, Colombia, Canada and Russia among the main suppliers.
Employment tells its own story about how this growth arrives. Direct jobs in mining reached about two hundred and thirty thousand early this year, a modest gain against the revenue expansion, which points to automation and capital intensity rather than hiring.
Do American tariffs threaten Brazil mineral exports?
Not directly under the proposal as published, because iron ore appears on the exemption annex and copper is excluded as a metal already covered by separate American duties. The exposure sits in manufactured goods rather than raw commodities, which is why industrial exports to the United States fell by more than a billion dollars in the first half while ore shipments rose.
Why did copper exports rise so much faster than volume?
Because price did most of the work. Volume rose about thirty percent while value rose eighty-four, which implies an average export price up roughly forty-two percent, to around four thousand five hundred and sixty dollars a tonne.
What should an investor watch next?
Watch whether European and Indian copper buying holds once the current price spike eases, since that would signal a structural shift rather than a trading response. On iron ore, the number that matters is the Chinese share, because seventy-seven percent concentration means Brazilian export revenue tracks Chinese construction and steel policy more than anything decided in Washington.
More: Brazil news in English, every day from The Rio Times.
Frequently Asked Questions
How much did Brazil's copper ore and concentrate exports earn in the first half of 2026?
They reached $3.87 billion, which was an 84% increase from $2.10 billion a year earlier. Volume rose 30% to 848,500 tonnes.
Which country was the leading buyer of Brazil's copper ore?
Germany led copper purchases at $865.1 million, not China. India's purchases also rose significantly, from $50.1 million to $376.4 million.
How do Brazil's iron ore and copper ore export earnings compare to its total sales to the United States?
Together they earned about $17.27 billion in the first half, which is roughly what Brazil sold to the entire United States market in the same six months ($17.4 billion).
This article was produced by The Rio Times’ automated newsroom system. How we use AI · Report an error
Read More from The Rio Times