IBOV 185,121.99 ▼ 0.65% IPSA 10,880.60 ▼ 0.81% IPC MEX 64,214.36 ▼ 1.38% MERVAL 2,781,799 ▼ 1.33% COLCAP 2,537.48 ▼ 0.46% BVL PERÚ 59,831.84 ▼ 0.49% USD/BRL5.22▲ 0.95% USD/MXN18.35▲ 1.57% USD/CLP984.10▲ 1.19% USD/COP3,315▼ 0.54% USD/PEN3.46▲ 0.73% USD/ARS1,525▼ 0.03% USD/UYU40.29▲ 3.66% USD/PYG5,804▲ 1.99% USD/BOB11.94▲ 2.03% USD/DOP59.52▲ 3.22% USD/CRC453.80▲ 2.74% USD/GTQ7.64▲ 3.23% USD/HNL26.87▲ 3.24% USD/NIO36.62▲ 2.66% USD/VES858.02▼ 0.13% USD/PAB1.00— 0.00% USD/BZD2.00— 0.00% USD/JMD 157.28 — 0.00% USD/TTD6.69▲ 1.81% EUR/BRL5.87▼ 0.48% BRENT 88.88 ▼ 0.03% WTI 83.11 ▼ 0.11% IRON ORE 161.91 — — COPPER 6.61 ▲ 0.03% GOLD 4,461 ▲ 1.78% SILVER 65.59 ▲ 1.26% SOY 1,184 ▲ 3.20% CORN 480.50 ▲ 10.02% WHEAT 655.00 ▲ 3.93% COFFEE 317.25 ▼ 5.51% SUGAR 16.43 ▼ 1.79% ORANGE JUICE 138.55 ▼ 0.47% COTTON 85.03 ▲ 2.33% COCOA 5,719 ▲ 3.18% BEEF 223.60 ▼ 3.93% CATTLE 339.10 ▼ 3.16% LITHIUM 75.20 ▲ 1.47% PETR4 41.64 ▼ 0.05% VALE3 72.97 ▲ 0.83% ITUB4 38.60 ▼ 1.03% BBDC4 16.85 ▲ 0.36% ABEV3 14.89 ▼ 0.80% BBAS3 19.37 ▲ 0.47% B3SA3 14.26 ▼ 0.21% WEGE3 47.59 ▲ 0.49% PRIO3 59.14 ▼ 0.19% SUZB3 41.33 ▲ 2.35% RENT3 34.68 ▼ 0.09% AZZA3 15.89 ▼ 2.63% CSAN3 3.22 ▼ 1.83% RAIZ4 0.25 — 0.00% PCAR3 2.75 ▼ 0.36% GMAT3 3.65 ▼ 1.08% PSSA3 48.13 ▼ 0.54% CVCB3 1.33 ▼ 2.92% POSI3 3.36 ▲ 2.44% SLCE3 13.34 ▲ 0.30% NATU3 8.14 ▼ 0.73% IBOV 185,121.99 ▼ 0.65% IPSA 10,880.60 ▼ 0.81% IPC MEX 64,214.36 ▼ 1.38% MERVAL 2,781,799 ▼ 1.33% COLCAP 2,537.48 ▼ 0.46% BVL PERÚ 59,831.84 ▼ 0.49% USD/BRL 5.16 ▲ 0.01% USD/MXN 17.06 ▼ 0.24% USD/CLP 913.98 ▲ 0.04% USD/COP 3,140 ▲ 0.03% USD/PEN 3.36 ▼ 0.66% USD/ARS 1,493 ▲ 0.10% USD/UYU 40.27 ▲ 1.24% USD/PYG 5,939 ▲ 1.68% USD/BOB 11.64 ▼ 0.76% USD/DOP 58.34 ▲ 1.25% USD/CRC 445.92 ▲ 0.89% USD/GTQ 7.62 ▲ 2.21% USD/HNL 26.79 ▲ 1.57% USD/NIO 36.62 ▲ 0.69% USD/VES 762.44 ▼ 0.13% USD/PAB 1.00 — 0.00% USD/BZD 2.00 — 0.00% USD/JMD 157.28 — 0.00% USD/TTD 6.70 ▲ 0.61% EUR/BRL 5.95 ▲ 1.01% BRENT 88.88 ▼ 0.03% WTI 83.11 ▼ 0.11% IRON ORE 161.91 — — COPPER 6.61 ▲ 0.03% GOLD 4,461 ▲ 1.78% SILVER 65.59 ▲ 1.26% SOY 1,184 ▲ 3.20% CORN 480.50 ▲ 10.02% WHEAT 655.00 ▲ 3.93% COFFEE 317.25 ▼ 5.51% SUGAR 16.43 ▼ 1.79% ORANGE JUICE 138.55 ▼ 0.47% COTTON 85.03 ▲ 2.33% COCOA 5,719 ▲ 3.18% BEEF 223.60 ▼ 3.93% CATTLE 339.10 ▼ 3.16% LITHIUM 75.20 ▲ 1.47% PETR4 41.64 ▼ 0.05% VALE3 72.97 ▲ 0.83% ITUB4 38.60 ▼ 1.03% BBDC4 16.85 ▲ 0.36% ABEV3 14.89 ▼ 0.80% BBAS3 19.37 ▲ 0.47% B3SA3 14.26 ▼ 0.21% WEGE3 47.59 ▲ 0.49% PRIO3 59.14 ▼ 0.19% SUZB3 41.33 ▲ 2.35% RENT3 34.68 ▼ 0.09% AZZA3 15.89 ▼ 2.63% CSAN3 3.22 ▼ 1.83% RAIZ4 0.25 — 0.00% PCAR3 2.75 ▼ 0.36% GMAT3 3.65 ▼ 1.08% PSSA3 48.13 ▼ 0.54% CVCB3 1.33 ▼ 2.92% POSI3 3.36 ▲ 2.44% SLCE3 13.34 ▲ 0.30% NATU3 8.14 ▼ 0.73%
since 2009
Thursday, October 1, 2026

Brazil Latin America

Brazil Manufacturing PMI Falls to 44.8 in September, Steepest Slump Since April 2023

By · October 1, 2026 · 3 min read

The LatAm Brief

One email, every weekday morning. What moved in Latin American markets, politics and expat life.

Yesterday’s subject line: “Banxico has missed its target for 75 months in a row”

Free. We send a confirmation link first — nothing arrives until you click it. Unsubscribe with one click in any edition. If you stop opening us for 30 days we stop sending by ourselves, as we assume the interest is no longer there. See our privacy policy. We never share your email.

ECONOMY · BRAZIL

Key Facts

  • —The country Brazil, Latin America’s largest economy and its biggest manufacturing base, publishes a monthly factory survey compiled by S&P Global.
  • —What happened The Brazil manufacturing PMI fell to 44.8 in September from 46.3 in August, S&P Global said on 1 October 2026. Readings below 50 signal contraction.
  • —The numbers The third-quarter average was 46.2, the lowest since the second quarter of 2023. Factories cut staff for a third month, though more slowly than in August.
  • —What it means for you Weaker orders mean slower hiring and tighter supplier margins. Input costs rose faster again, yet competition kept the rise in factory selling prices to a seven-month low.
  • —Still open Whether demand recovers after October’s presidential election, as surveyed firms expect, and how far energy and transport costs keep rising.

The Brazil manufacturing PMI fell to 44.8 in September from 46.3 in August, S&P Global reported on Thursday 1 October 2026. It marks the sharpest deterioration in factory conditions since April 2023.

Free daily brief — no card needed
Get every Brazil story in one morning email
We build you a personalized brief around the topics you follow — free for 7 days. Love it? Your first month after that is US$1.

The purchasing managers’ index (PMI) surveys factory buyers on orders, output, jobs and prices each month. Any reading below 50 means conditions worsened from the month before.

Workers assemble tractor drivetrains at a factory in Mogi das Cruzes, Brazil
Workers assemble tractor drivetrains at a machinery plant in Mogi das Cruzes, São Paulo state.
One-stop reference
Company Intelligence
Every listed company in Latin America — financials, ownership and structure for 1,450+ companies across 26 exchanges, in one place.
Browse the directory →
RT
Ask Rio Times
Latin American markets, currencies and companies.
Open the full Ask Rio Times →

Demand weakens ahead of the election

Firms told S&P Global that weak demand, competitive pressure and political uncertainty before October’s presidential election held back sales. Reuters reported the details from the survey on Thursday.

The September figure pulled the third-quarter average down to 46.2. That is the weakest quarterly reading since the second quarter of 2023, according to S&P Global.
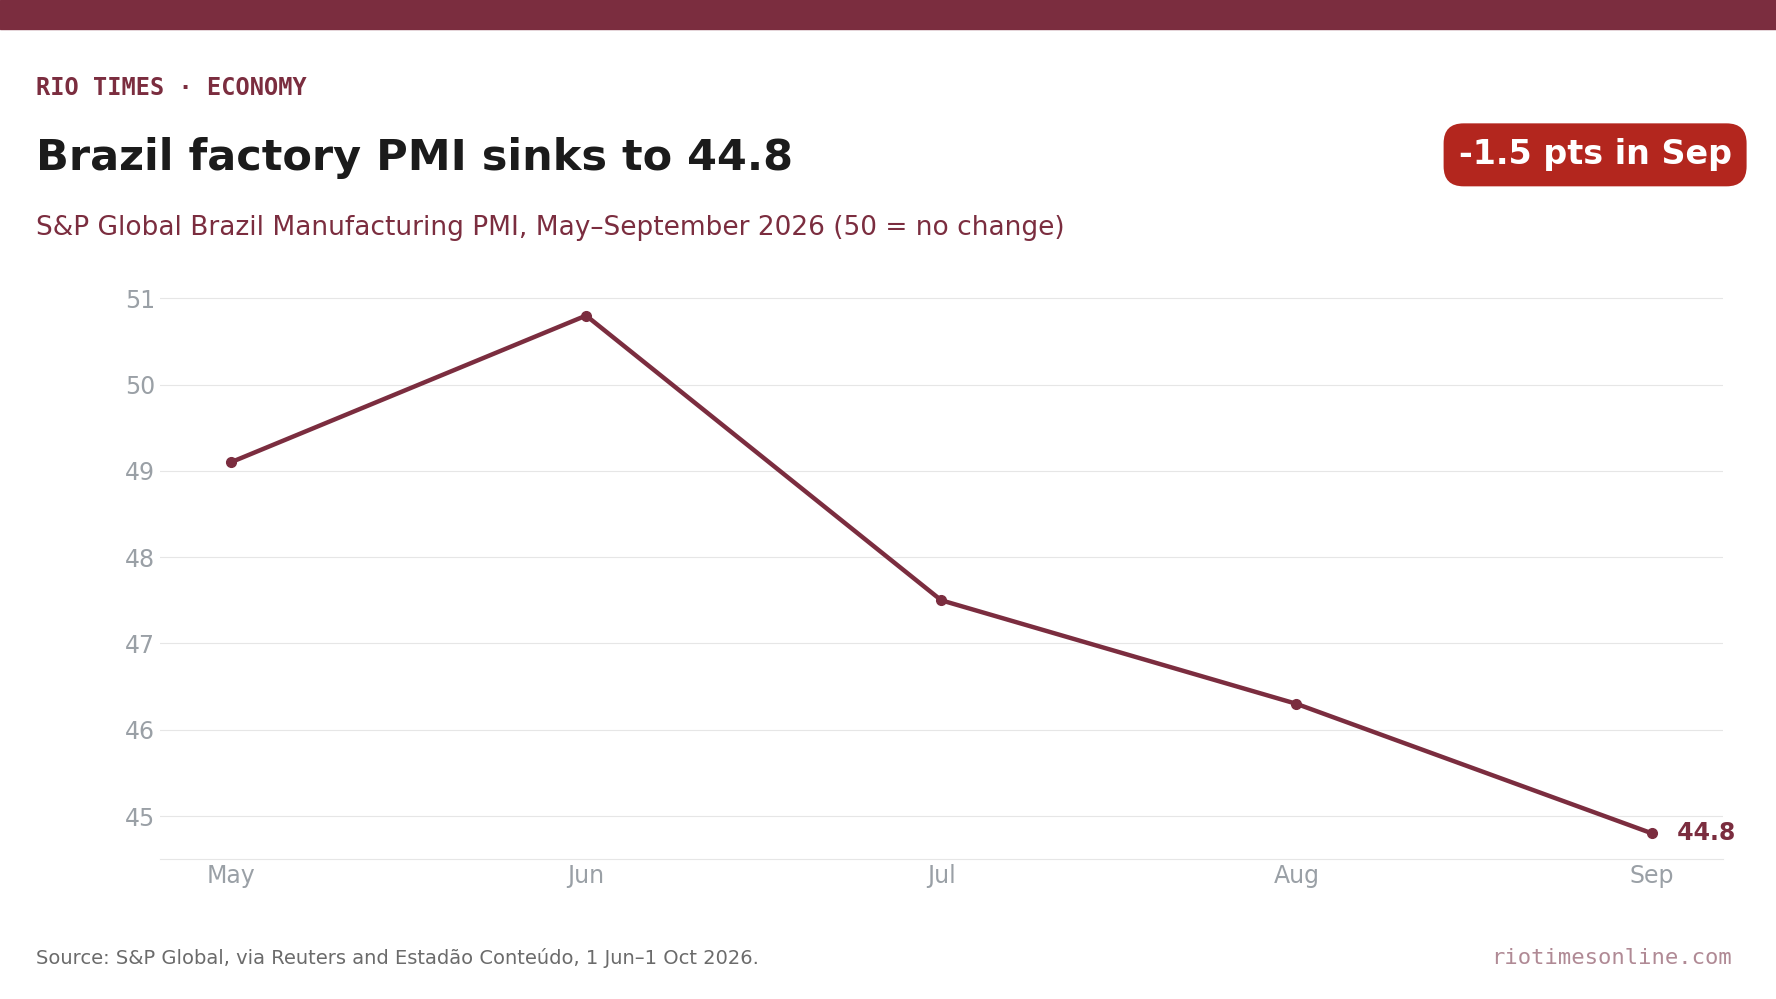
Rio Times chart: Brazil Manufacturing PMI, May to September 2026, falling from 50.8 in June to 44.8 in September
S&P Global Brazil Manufacturing PMI, May to September 2026; readings below 50 signal contraction. Source: S&P Global, via Reuters and Estadão Conteúdo, 1 June to 1 October 2026.

The slide has been steady rather than sudden. The index stood above 50 in June, then fell in each of the three months that followed.

Jobs and prices

Manufacturers reduced headcount for a third straight month in September. The pace of job cuts was moderate, however, and softer than in August.

Cost pressures returned after easing for four months in a row. Input price inflation picked up and moved back above its long-run average, according to the survey.

Firms blamed higher material and transport costs on the global energy crisis and the war in the Middle East. Many raised their own selling prices in response.

Competition and falling sales limited that pricing power, though. Inflation in prices charged by factories eased to its lowest level in seven months.

A brighter outlook for 2027

Business confidence about the next 12 months improved from August. That was the one bright spot in the data, said Pollyanna De Lima of S&P Global Market Intelligence.

“Companies continued to be more optimistic about the next 12 months, supported by expectations that market conditions will improve after the elections,” she said, as quoted by Reuters in Portuguese and translated here.

The survey adds to signs of a slower economy in the second half. Official forecasters recently trimmed their 2026 outlook, as covered in Brazil Cuts 2026 Growth Forecast to 2.0% on Weak Services, Industry.

For markets, the factory survey was one of Thursday’s key data points, flagged in Brazil’s Financial Morning Call for Thursday, October 1, 2026.

What Is Not Yet Known

The survey does not say how much of the weakness is tied to the election itself. A clearer test comes with the October reading, due in early November.

Official industrial production data for September from IBGE, the national statistics institute, have not yet been released. They will show whether hard output figures match the survey’s gloom.

It is also unclear how long the energy and transport cost shock will last. That will decide whether factory price pressures fade again or keep building.

Sources: S&P Global Brazil Manufacturing PMI, September 2026, as reported by Reuters (via InfoMoney, 1 October 2026); BM&C News, 1 October 2026; earlier monthly readings as reported by Estadão Conteúdo and CNN Brasil, June–September 2026.

LatAm Markets: Live Signals → — real-time movers, turnover leaders and FX across Latin America.

Read More from The Rio Times

The Rio Times · Power Map
See who really holds power in Latin America
Click to open the Power Map →

Rotate for Best Experience

This report is optimized for landscape viewing. Rotate your phone for the full experience.