
Trade
Key Facts
—The new order. In May the largest American bilateral deficits were with Vietnam ($20.6bn), Mexico ($20.1bn), Taiwan ($19.4bn) and China ($14.5bn), on a balance-of-payments basis.
—The Mexican jump. Mexico’s deficit widened by $5.3bn in a single month, from $14.8bn in April. Its exports to the United States fell while its imports rose.
—China’s fall. The country Washington built its tariff programme around now ranks fourth by monthly deficit, behind two smaller Asian economies and its southern neighbour.
—The annual picture. For 2025 the ranking still read European Union, China, Mexico, Vietnam, Taiwan, on a goods trade basis. The monthly data has inverted the middle of that list.
—The speed. Taiwan’s annual deficit rose $73.0bn in 2025 alone, to $146.8bn. Vietnam’s rose $54.7bn, to $178.2bn.
—The stakes. Washington has said tariffs on Mexico stay until the deficit narrows. It just widened.
The US trade deficit with Vietnam was larger in May than the deficit with Mexico. The gap with Taiwan was larger than the gap with China, and for a policy built on a league table, the table has moved.
The figures come from the American statistical agencies that publish trade data each month. They record what the United States buys from a country against what it sells there, and the difference is the deficit.
For May the four largest were Vietnam, then Mexico, then Taiwan, then China. Written down that way the sentence looks unremarkable, until you recall which country the last decade of American trade policy was designed around.
How the US trade deficit league table flipped
In April the order was different. Taiwan and Vietnam were level at the top, Mexico sat third on a much smaller figure, and China was fourth.
Then Mexico’s deficit jumped by five point three billion dollars in a single month, according to the Bureau of Economic Analysis. American exports to Mexico fell while American imports from Mexico climbed.
That was enough to put Mexico second, and still not enough to make it first. Vietnam edged ahead by half a billion dollars, a margin thinner than the monthly revisions these series routinely carry.
Read the two months together and a pattern appears. Three economies, none of them China, now sit above China in the monthly ranking, and the closest of them is Mexico.
Does one month of US trade deficit data mean anything?
On its own, not much. Monthly trade figures are volatile, they are revised, and a single shipment of aircraft or gold can move a bilateral number by billions.
The annual series is steadier and tells a longer version of the same story. Across 2025 the American deficit with Taiwan grew by seventy-three billion dollars and the deficit with Vietnam by nearly fifty-five billion.
Those are not rounding errors. Taiwan’s annual deficit roughly doubled inside twelve months, and Vietnam’s grew by more than two fifths.
Meanwhile the overall American shortfall for 2025 came to nearly nine hundred billion dollars, barely changed on the year before. The total held steady while its composition rearranged underneath.
May itself was a bad month for the headline number. The combined goods and services trade deficit widened to $77.6 billion in May 2026, up from a revised $54.6 billion in April 2026.
Imports climbed to their highest level in more than a year, driven by consumer goods, crude oil and passenger cars. Exports fell, weighed down by lower shipments of precious metals and computers.
There is a countervailing fact worth stating plainly. Measured year to date, the American deficit is far smaller than it was in the same months of 2025, because exports have risen sharply while imports edged down.
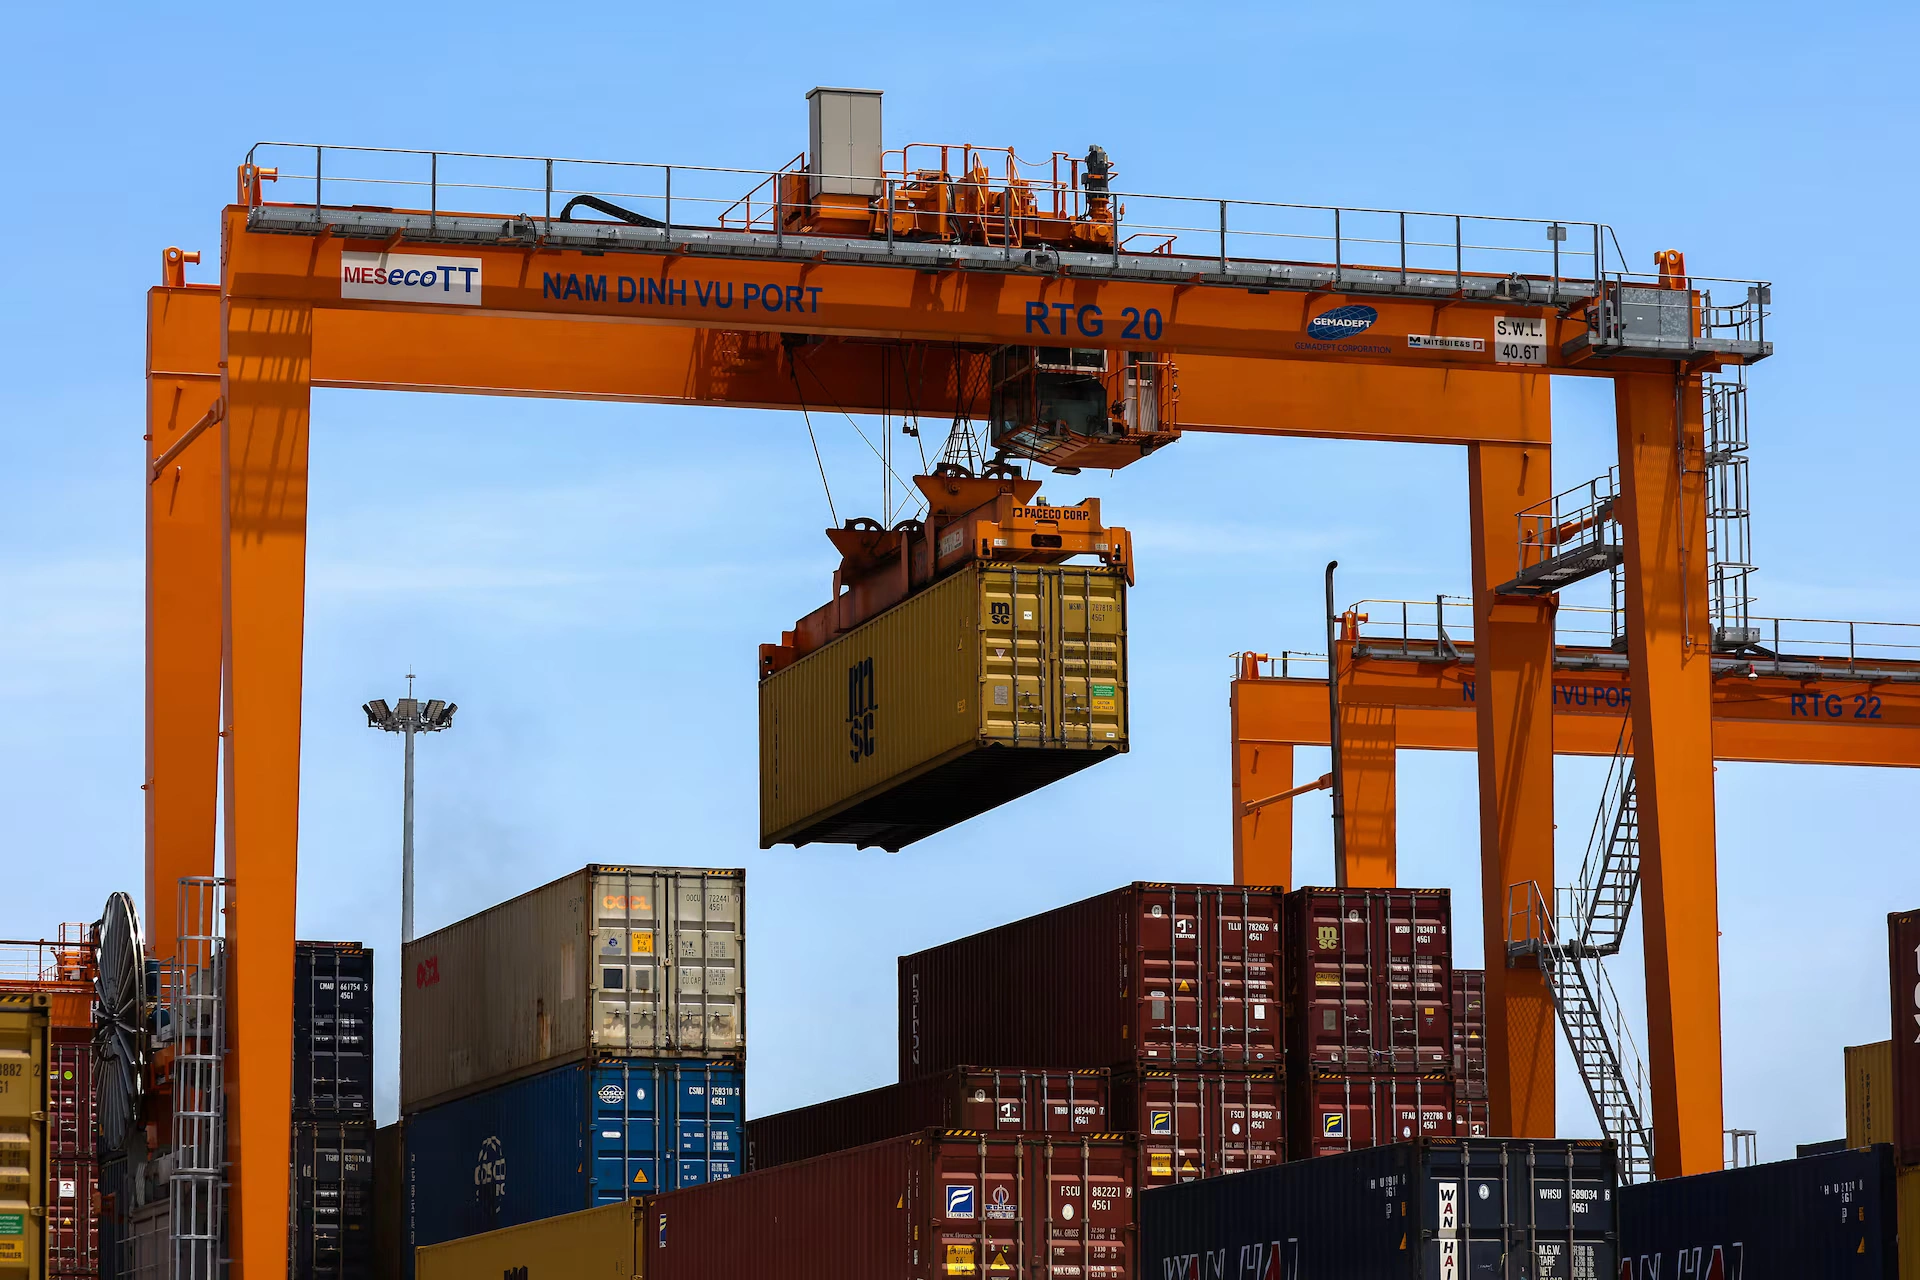
Why this matters in Mexico City
Washington has tied its tariffs to precisely this number. The United States Trade Representative has said levies on Mexico and Canada remain in place until the trade deficit narrows.
In May the deficit with Mexico did the opposite. It grew by more than a third in one month, just as the North American trade pact entered a decade of annual reviews rather than a clean sixteen-year renewal.
There is a second reading, and Mexican officials will prefer it. A deficit that widens because American factories are buying more Mexican components is evidence of the integration that nearshoring was supposed to produce.
Both readings use the same figure. Which one prevails is a political question rather than a statistical one, and the answer will be argued out in review meetings rather than in spreadsheets.
One further line in the same release deserves attention across the region. The United States ran a surplus with South and Central America in May, and a smaller one with Brazil, meaning it sold more to those markets than it bought.
That is the opposite of the Mexican position. It explains why Washington’s tariff arguments have landed so differently across Latin America, since a country that buys more American goods than it sells is not the target of a deficit-driven trade policy.
What does this say about the tariffs on China?
They moved production rather than eliminating it. Goods that once shipped from Chinese factories now ship from Vietnamese and Taiwanese ones, and the American import bill barely noticed.
This is why Washington’s negotiators keep returning to rules of origin, the technical clauses that decide where a product legally comes from. The deficit moved address; the question is whether the content did.
What should investors watch from here?
The June figures, and whether Mexico’s May jump was a one-month distortion or the start of a trend. A second consecutive widening would hand Washington its argument on a plate.
Watch also whether Vietnam holds first place. If it does, the country most exposed to an American tariff response is no longer the one the tariffs were written for.
Connected Coverage
The Clock Starts Ticking on North America’s $2 Trillion Trade Pact
More: Latin America news in English, every day from The Rio Times.
Live Company IntelligenceGrupo Aeroportuario del Pacífico S.A.B. de C.V — the full investor dossier
Valuation & profitability
Price & risk
$338.3552-wk high
$512.65
Revenue trend · 6y
Ownership
Dividend
Frequently Asked Questions
Which country now has the largest monthly trade deficit with the US?
Vietnam now tops the list, with a $20.6 billion deficit in May, edging ahead of Mexico by about half a billion dollars. Taiwan ($19.4bn) and China ($14.5bn) round out the top four.
Why did Mexico's trade deficit with the US jump so sharply in May?
Mexico's deficit grew by $5.3 billion in a single month, rising from $14.8 billion in April to $20.1 billion in May. American exports to Mexico fell while American imports from Mexico rose, and Washington has said its tariffs stay in place until that deficit narrows.
What happened to China's trade deficit with the US after years of American tariffs targeting it?
China now ranks fourth in monthly deficit at $14.5 billion, sitting behind Vietnam, Mexico, and Taiwan, all much smaller economies. The data suggests production shifted from Chinese factories to Vietnamese and Taiwanese ones rather than disappearing, so the import bill for the US barely changed.
This article was produced by The Rio Times’ automated newsroom system. How we use AI · Report an error · Editorial responsibility: Matthias Camenzind, Editor-in-Chief
In depth