IBOV 183,965.91 ▼ 0.99% IPSA 11,300.53 ▼ 1.30% IPC MEX 64,000.41 ▼ 0.43% MERVAL 2,939,964 ▼ 1.00% COLCAP 2,609.40 ▼ 0.12% BVL PERÚ 59,677.00 ▲ 0.43% USD/BRL5.19▲ 0.41% USD/MXN17.73▲ 1.12% USD/CLP961.42▼ 0.10% USD/COP3,351▲ 4.44% USD/PEN3.41▲ 1.05% USD/ARS1,520▲ 0.23% USD/UYU40.05▲ 2.84% USD/PYG5,894▲ 2.17% USD/BOB12.18▲ 14.34% USD/DOP59.23▲ 0.39% USD/CRC450.75▲ 4.23% USD/GTQ7.64▲ 3.19% USD/HNL26.85▲ 3.15% USD/NIO36.62▲ 2.62% USD/VES852.33▼ 0.13% USD/PAB1.00— 0.00% USD/BZD2.00— 0.00% USD/JMD 157.28 — 0.00% USD/TTD6.77▲ 2.69% EUR/BRL5.91▲ 1.22% BRENT 88.88 ▼ 0.03% WTI 83.11 ▼ 0.11% IRON ORE 161.91 — — COPPER 6.61 ▲ 0.03% GOLD 4,461 ▲ 1.78% SILVER 65.59 ▲ 1.26% SOY 1,184 ▲ 3.20% CORN 480.50 ▲ 10.02% WHEAT 655.00 ▲ 3.93% COFFEE 317.25 ▼ 5.51% SUGAR 16.43 ▼ 1.79% ORANGE JUICE 138.55 ▼ 0.47% COTTON 85.03 ▲ 2.33% COCOA 5,719 ▲ 3.18% BEEF 223.60 ▼ 3.93% CATTLE 339.10 ▼ 3.16% LITHIUM 75.20 ▲ 1.47% PETR4 41.64 ▼ 0.05% VALE3 72.97 ▲ 0.83% ITUB4 38.60 ▼ 1.03% BBDC4 16.85 ▲ 0.36% ABEV3 14.89 ▼ 0.80% BBAS3 19.37 ▲ 0.47% B3SA3 14.26 ▼ 0.21% WEGE3 47.59 ▲ 0.49% PRIO3 59.14 ▼ 0.19% SUZB3 41.33 ▲ 2.35% RENT3 34.68 ▼ 0.09% AZZA3 15.89 ▼ 2.63% CSAN3 3.22 ▼ 1.83% RAIZ4 0.25 — 0.00% PCAR3 2.75 ▼ 0.36% GMAT3 3.65 ▼ 1.08% PSSA3 48.13 ▼ 0.54% CVCB3 1.33 ▼ 2.92% POSI3 3.36 ▲ 2.44% SLCE3 13.34 ▲ 0.30% NATU3 8.14 ▼ 0.73% IBOV 183,965.91 ▼ 0.99% IPSA 11,300.53 ▼ 1.30% IPC MEX 64,000.41 ▼ 0.43% MERVAL 2,939,964 ▼ 1.00% COLCAP 2,609.40 ▼ 0.12% BVL PERÚ 59,677.00 ▲ 0.43% USD/BRL 5.16 ▲ 0.01% USD/MXN 17.06 ▼ 0.24% USD/CLP 913.98 ▲ 0.04% USD/COP 3,140 ▲ 0.03% USD/PEN 3.36 ▼ 0.66% USD/ARS 1,493 ▲ 0.10% USD/UYU 40.27 ▲ 1.24% USD/PYG 5,939 ▲ 1.68% USD/BOB 11.64 ▼ 0.76% USD/DOP 58.34 ▲ 1.25% USD/CRC 445.92 ▲ 0.89% USD/GTQ 7.62 ▲ 2.21% USD/HNL 26.79 ▲ 1.57% USD/NIO 36.62 ▲ 0.69% USD/VES 762.44 ▼ 0.13% USD/PAB 1.00 — 0.00% USD/BZD 2.00 — 0.00% USD/JMD 157.28 — 0.00% USD/TTD 6.70 ▲ 0.61% EUR/BRL 5.95 ▲ 1.01% BRENT 88.88 ▼ 0.03% WTI 83.11 ▼ 0.11% IRON ORE 161.91 — — COPPER 6.61 ▲ 0.03% GOLD 4,461 ▲ 1.78% SILVER 65.59 ▲ 1.26% SOY 1,184 ▲ 3.20% CORN 480.50 ▲ 10.02% WHEAT 655.00 ▲ 3.93% COFFEE 317.25 ▼ 5.51% SUGAR 16.43 ▼ 1.79% ORANGE JUICE 138.55 ▼ 0.47% COTTON 85.03 ▲ 2.33% COCOA 5,719 ▲ 3.18% BEEF 223.60 ▼ 3.93% CATTLE 339.10 ▼ 3.16% LITHIUM 75.20 ▲ 1.47% PETR4 41.64 ▼ 0.05% VALE3 72.97 ▲ 0.83% ITUB4 38.60 ▼ 1.03% BBDC4 16.85 ▲ 0.36% ABEV3 14.89 ▼ 0.80% BBAS3 19.37 ▲ 0.47% B3SA3 14.26 ▼ 0.21% WEGE3 47.59 ▲ 0.49% PRIO3 59.14 ▼ 0.19% SUZB3 41.33 ▲ 2.35% RENT3 34.68 ▼ 0.09% AZZA3 15.89 ▼ 2.63% CSAN3 3.22 ▼ 1.83% RAIZ4 0.25 — 0.00% PCAR3 2.75 ▼ 0.36% GMAT3 3.65 ▼ 1.08% PSSA3 48.13 ▼ 0.54% CVCB3 1.33 ▼ 2.92% POSI3 3.36 ▲ 2.44% SLCE3 13.34 ▲ 0.30% NATU3 8.14 ▼ 0.73%
since 2009
Thursday, September 24, 2026

Agri Business Business - Brazil

Soybean Prices Soar: Floods and Global Demand Shake Up Market

By · June 3, 2024 · 2 min read

The LatAm Brief

One email, every weekday morning. What moved in Latin American markets, politics and expat life.

Yesterday’s subject line: “Ecuador empties its streets at night, its plants by day”

Free. We send a confirmation link first — nothing arrives until you click it. Unsubscribe with one click in any edition. If you stop opening us for 30 days we stop sending by ourselves, as we assume the interest is no longer there. See our privacy policy. We never share your email.

Floods in Brazil’s Rio Grande do Sul caused uncertainty about Brazil’s soybean harvest, pushing prices higher in May. Farmers quickly took advantage by selling at peak prices.

In Passo Fundo, a 60-kilogram sack of soybeans jumped from R$123 ($23.43) to R$133 ($25.33).

In Cascavel, prices rose from R$123.50 ($23.52) to R$130 ($24.76). Rondonópolis saw an increase from R$116 ($22.10) to R$125.50 ($23.90).

Meanwhile, at the Port of Paranaguá, prices climbed from R$130 ($24.76) to R$138 ($26.29).

Despite increased supply, soybean premiums stayed firm due to strong Chinese demand.

Brazil’s soybean exports surged by 45% in May, marking the second-largest monthly export volume ever.

About 74% of these exports went to China, driven by competitive prices from a weaker Brazilian real.

On the Chicago Board of Trade (CBOT), July soybean contracts rose by 4.86% in May, reaching $12.19 1/2 per bushel.
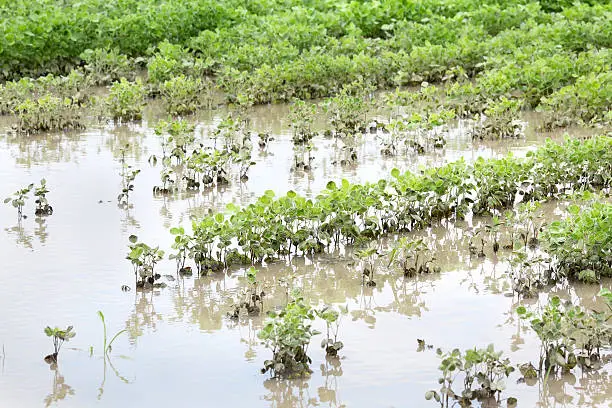
Soybean Prices Soar: Floods and Global Demand Shake Up Market.
One-stop reference
Company Intelligence
Every listed company in Latin America — financials, ownership and structure for 1,450+ companies across 26 exchanges, in one place.
Browse the directory →
RT
Ask Rio Times
Latin American markets, currencies and companies.
Open the full Ask Rio Times →

This increase occurred despite U.S. planting progress and weak American soybean demand. Production losses in Rio Grande do Sul helped maintain higher prices.

The exchange rate also favored Brazil’s soybean market. The commercial dollar appreciated by 0.33%, closing at R$5.2088 ($0.99).

Delayed U.S. interest rate cuts and fiscal concerns in Brazil supported this rise.

Soybean Prices in Brazil Soar: Floods and Global Demand Shake Up Market

Looking ahead to June, weather in the U.S. and final crop loss numbers in Rio Grande do Sul will influence prices.

The USDA’s monthly report and U.S. planting data, expected at the end of June, will be crucial for the market.

Why does this matter? Soybeans are a key global commodity, vital for animal feed and various products.

Price changes impact farmers, traders, and economies worldwide. Brazil’s role as a major exporter means its market conditions can affect global supply and demand dynamics.

Understanding these factors helps stakeholders make informed decisions, ensuring stability and profitability in the agricultural sector.

In summary, local production issues and global demand shifts have created a volatile yet potentially profitable market for Brazilian soybeans.

This situation underscores the interconnectedness of global agricultural markets and the importance of monitoring multiple factors to anticipate changes.

This article was produced by The Rio Times’ automated newsroom system. How we use AI · Report an error

Read More from The Rio Times

The Rio Times · Power Map
See who really holds power in Latin America
Click to open the Power Map →

Rotate for Best Experience

This report is optimized for landscape viewing. Rotate your phone for the full experience.