IBOV 175,135.41 ▲ 0.31% IPSA 11,470.79 ▲ 0.89% IPC MEX 65,829.98 ▼ 0.55% MERVAL 3,001,209 — 0.00% COLCAP 2,489.80 ▼ 0.59% BVL PERÚ 60,629.82 ▲ 0.25% USD/BRL5.16▼ 0.01% USD/MXN16.94▼ 0.24% USD/CLP923.58▼ 0.30% USD/COP3,155▲ 0.88% USD/PEN3.35▼ 0.05% USD/ARS1,512▼ 0.15% USD/UYU40.25▲ 1.53% USD/PYG5,905▲ 0.48% USD/BOB11.65▲ 2.81% USD/DOP58.53▲ 0.83% USD/CRC448.38▲ 1.62% USD/GTQ7.63▲ 2.37% USD/HNL26.83▲ 1.77% USD/NIO36.62▼ 0.02% USD/VES789.69▼ 0.08% USD/PAB1.00— 0.00% USD/BZD2.00— 0.00% USD/JMD 157.28 — 0.00% USD/TTD6.73▲ 1.14% EUR/BRL6.01▲ 0.24% BRENT 88.88 ▼ 0.03% WTI 83.11 ▼ 0.11% IRON ORE 161.91 — — COPPER 6.61 ▲ 0.03% GOLD 4,461 ▲ 1.78% SILVER 65.59 ▲ 1.26% SOY 1,184 ▲ 3.20% CORN 480.50 ▲ 10.02% WHEAT 655.00 ▲ 3.93% COFFEE 317.25 ▼ 5.51% SUGAR 16.43 ▼ 1.79% ORANGE JUICE 138.55 ▼ 0.47% COTTON 85.03 ▲ 2.33% COCOA 5,719 ▲ 3.18% BEEF 223.60 ▼ 3.93% CATTLE 339.10 ▼ 3.16% LITHIUM 75.20 ▲ 1.47% PETR4 41.64 ▼ 0.05% VALE3 72.97 ▲ 0.83% ITUB4 38.60 ▼ 1.03% BBDC4 16.85 ▲ 0.36% ABEV3 14.89 ▼ 0.80% BBAS3 19.37 ▲ 0.47% B3SA3 14.26 ▼ 0.21% WEGE3 47.59 ▲ 0.49% PRIO3 59.14 ▼ 0.19% SUZB3 41.33 ▲ 2.35% RENT3 34.68 ▼ 0.09% AZZA3 15.89 ▼ 2.63% CSAN3 3.22 ▼ 1.83% RAIZ4 0.25 — 0.00% PCAR3 2.75 ▼ 0.36% GMAT3 3.65 ▼ 1.08% PSSA3 48.13 ▼ 0.54% CVCB3 1.33 ▼ 2.92% POSI3 3.36 ▲ 2.44% SLCE3 13.34 ▲ 0.30% NATU3 8.14 ▼ 0.73% IBOV 175,135.41 ▲ 0.31% IPSA 11,470.79 ▲ 0.89% IPC MEX 65,829.98 ▼ 0.55% MERVAL 3,001,209 — 0.00% COLCAP 2,489.80 ▼ 0.59% BVL PERÚ 60,629.82 ▲ 0.25% USD/BRL 5.16 ▲ 0.01% USD/MXN 17.06 ▼ 0.24% USD/CLP 913.98 ▲ 0.04% USD/COP 3,140 ▲ 0.03% USD/PEN 3.36 ▼ 0.66% USD/ARS 1,493 ▲ 0.10% USD/UYU 40.27 ▲ 1.24% USD/PYG 5,939 ▲ 1.68% USD/BOB 11.64 ▼ 0.76% USD/DOP 58.34 ▲ 1.25% USD/CRC 445.92 ▲ 0.89% USD/GTQ 7.62 ▲ 2.21% USD/HNL 26.79 ▲ 1.57% USD/NIO 36.62 ▲ 0.69% USD/VES 762.44 ▼ 0.13% USD/PAB 1.00 — 0.00% USD/BZD 2.00 — 0.00% USD/JMD 157.28 — 0.00% USD/TTD 6.70 ▲ 0.61% EUR/BRL 5.95 ▲ 1.01% BRENT 88.88 ▼ 0.03% WTI 83.11 ▼ 0.11% IRON ORE 161.91 — — COPPER 6.61 ▲ 0.03% GOLD 4,461 ▲ 1.78% SILVER 65.59 ▲ 1.26% SOY 1,184 ▲ 3.20% CORN 480.50 ▲ 10.02% WHEAT 655.00 ▲ 3.93% COFFEE 317.25 ▼ 5.51% SUGAR 16.43 ▼ 1.79% ORANGE JUICE 138.55 ▼ 0.47% COTTON 85.03 ▲ 2.33% COCOA 5,719 ▲ 3.18% BEEF 223.60 ▼ 3.93% CATTLE 339.10 ▼ 3.16% LITHIUM 75.20 ▲ 1.47% PETR4 41.64 ▼ 0.05% VALE3 72.97 ▲ 0.83% ITUB4 38.60 ▼ 1.03% BBDC4 16.85 ▲ 0.36% ABEV3 14.89 ▼ 0.80% BBAS3 19.37 ▲ 0.47% B3SA3 14.26 ▼ 0.21% WEGE3 47.59 ▲ 0.49% PRIO3 59.14 ▼ 0.19% SUZB3 41.33 ▲ 2.35% RENT3 34.68 ▼ 0.09% AZZA3 15.89 ▼ 2.63% CSAN3 3.22 ▼ 1.83% RAIZ4 0.25 — 0.00% PCAR3 2.75 ▼ 0.36% GMAT3 3.65 ▼ 1.08% PSSA3 48.13 ▼ 0.54% CVCB3 1.33 ▼ 2.92% POSI3 3.36 ▲ 2.44% SLCE3 13.34 ▲ 0.30% NATU3 8.14 ▼ 0.73%
since 2009
Friday, August 28, 2026

Agri Business Business - Brazil

South America Sees 12.4% Rise in Coffee Shipments, Led by Brazil

By · January 7, 2025 · 2 min read

Daily Brief

The morning intel from across Latin America. Free.

By subscribing you agree to our privacy policy. We never share your email.

The International Coffee Organization (ICO) in London reports a significant surge in Brazilian coffee exports. The country’s coffee shipments increased by 13.2% in October 2024, reaching 4.94 million bags.

This marks the highest export volume for Brazil since November 2020. Brazil’s coffee industry demonstrates remarkable resilience and growth. The country’s exports drove South America’s overall coffee shipments up by 12.4% to 6.69 million bags in October 2024.

This regional performance set a new record, surpassing the previous high of 6.57 million bags in November 2020. Global coffee prices also experienced a substantial uptick.

The ICO Composite Indicator Price (CIP) averaged 270.72 US cents per pound in November 2024. This represents an 8% increase from October and a staggering 67.6% rise compared to November 2023.

World coffee consumption reached 177 million 60kg bags in the twelve months from October 2023 to September 2024. This slight increase of 2.25% occurred alongside a 5.82% growth in global production, which rose from 168.2 million to 178 million bags.
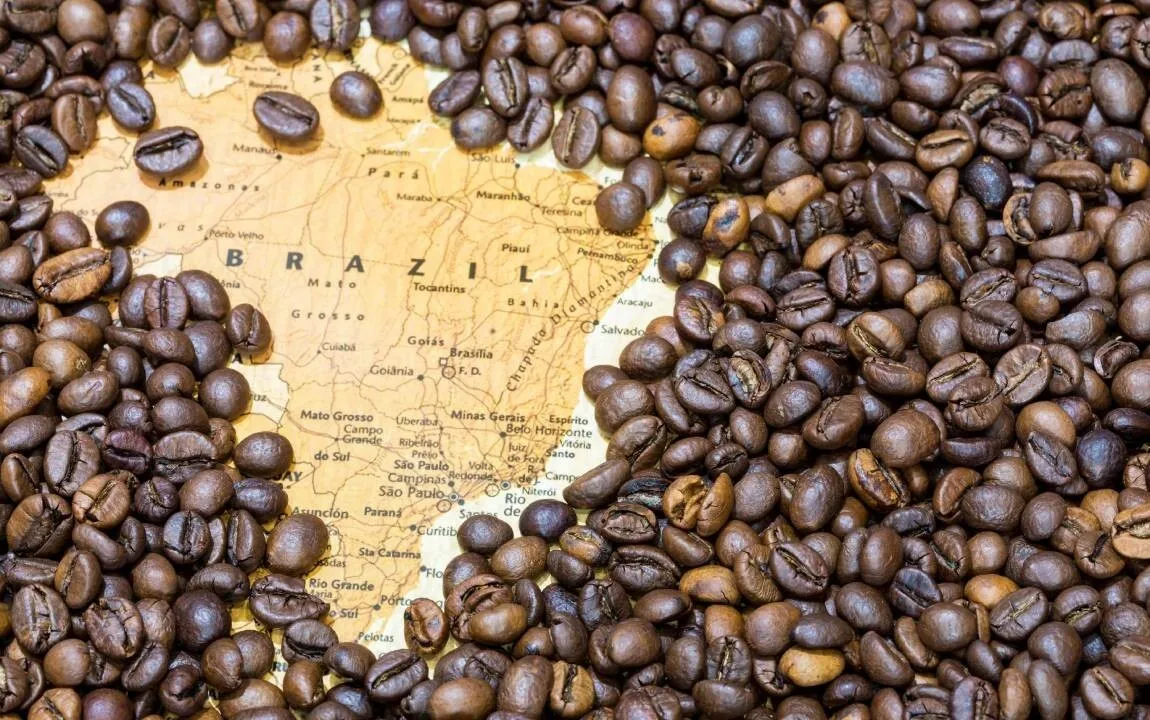
South America Sees 12.4% Rise in Coffee Shipments, Led by Brazil
South America Sees 12.4% Rise in Coffee Shipments, Led by Brazil. (Photo Internet reproduction)
One-stop reference
Company Intelligence
Every listed company in Latin America — financials, ownership and structure for 1,450+ companies across 26 exchanges, in one place.
Browse the directory →
RT
Ask Rio Times
Latin American markets, currencies and companies.
Open the full Ask Rio Times →

Arabica coffee dominated global production, accounting for 57.41% of the total. Robusta and Conilon varieties made up the remaining 42.59%. South America led production with 50.17% of the global share, followed by Asia and Oceania at 28.03%.

Coffee-producing countries consumed 31.92% of global production, while importing nations accounted for 68.08%. Europe emerged as the top consumer, drinking 30.34% of the world’s coffee, followed by Asia and Oceania at 25.82%.

These figures highlight the coffee industry’s dynamic nature and Brazil’s pivotal role in the global market. The country’s strong export performance, coupled with rising prices, signals a robust period for coffee producers and traders alike.

This article was produced by The Rio Times’ automated newsroom system. How we use AI · Report an error

Read More from The Rio Times

The Rio Times · Power Map
See who really holds power in Latin America
Click to open the Power Map

Rotate for Best Experience

This report is optimized for landscape viewing. Rotate your phone for the full experience.