Kenya’s IMF Test Comes Due as the Shilling Holds Near KSh 129.47
Economy · Kenya
Key Facts
- —The stakes Kenya’s public debt is at high distress risk; external debt service consumes nearly a third of tax revenue.
- —The currency The shilling held a narrow KSh 128.9-130 band from late 2025 into September 2026, trading at KSh 129.47 to the dollar on September 4, 2026.
- —The IMF Kenya’s last loan programme lapsed in 2025 after it missed the final review; a new deal is still being negotiated, with no agreement confirmed by September 2026.
- —The inflation story Headline inflation rose from 4.3% in February 2026 to 6.7% in May 2026 on energy and transport costs.
- —The catch Despite the stable shilling, real stress is fiscal arithmetic, not the exchange rate.
Kenya ends 2026 with a rare mix: a very stable shilling and a debt bill that still scares lenders.
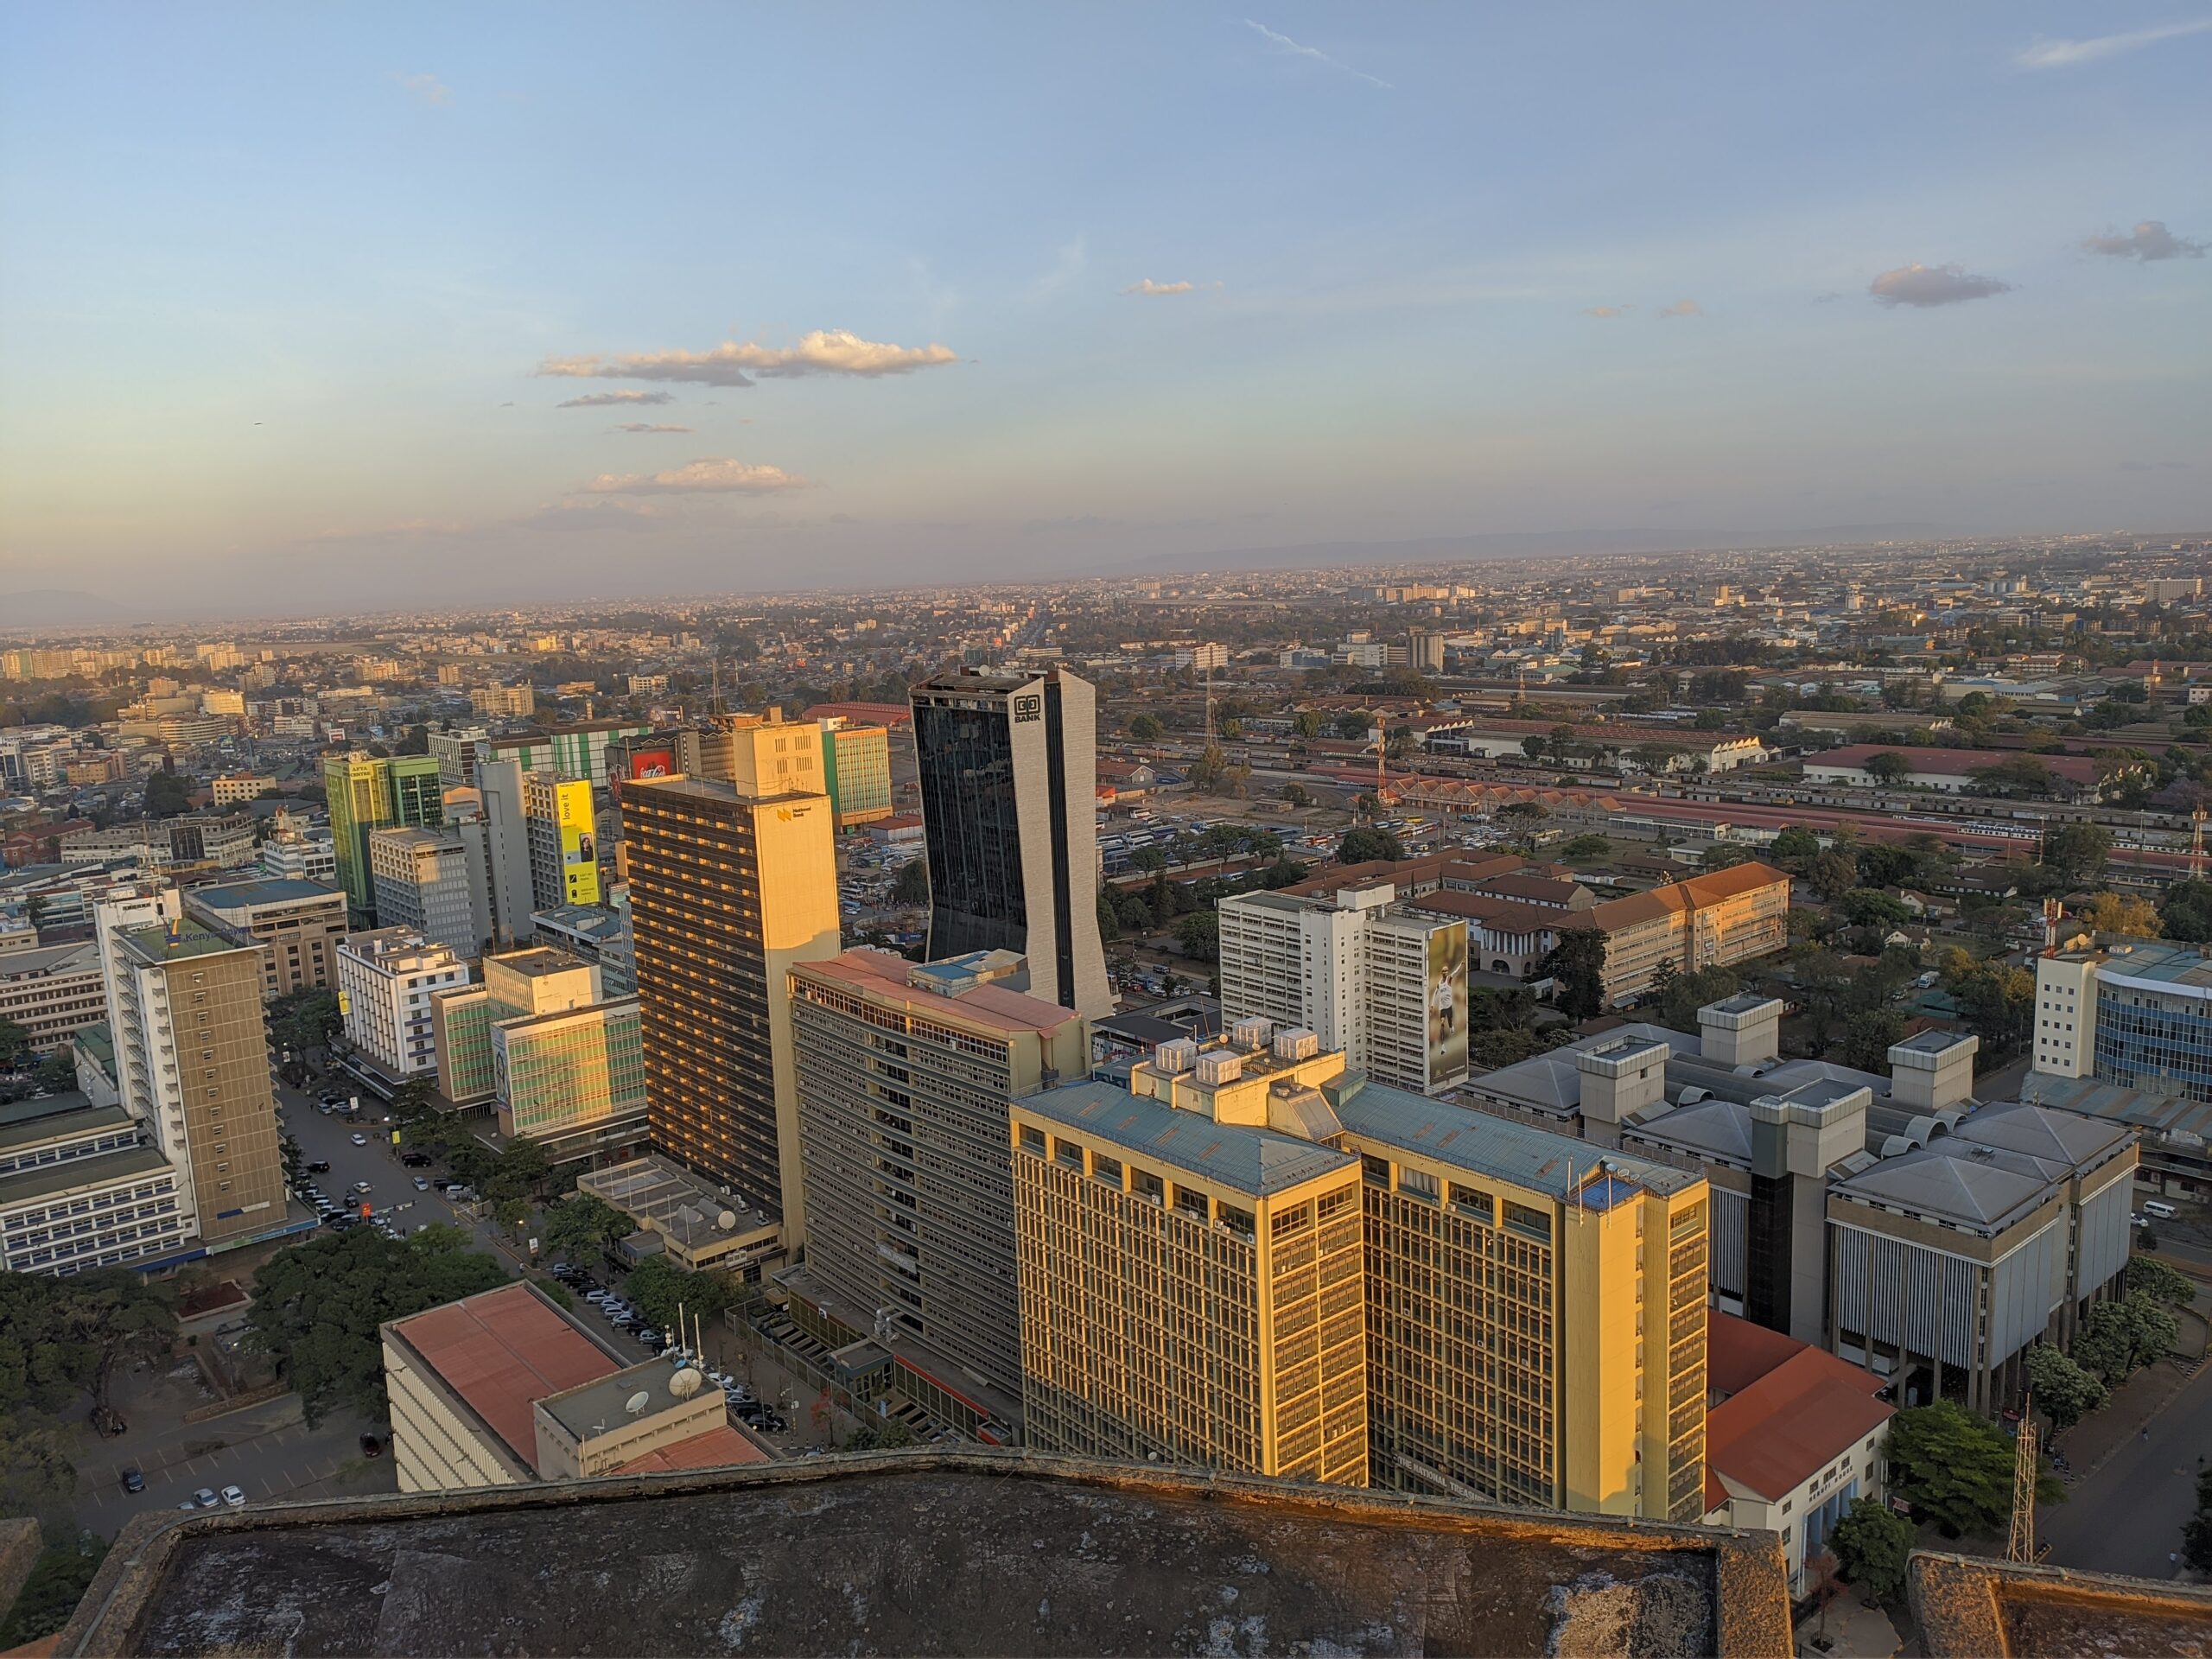
The real problem is not the exchange rate but the math of government finances.
Growth slows, inflation turns volatile
Kenya’s economy expanded 4.9 percent year-on-year in the third quarter of 2025, up from 4.2 percent in the same quarter of 2024.
The National Treasury projected 5.3 percent GDP growth for 2025, while the World Bank expected only a gradual medium-term recovery.
Headline inflation fell from 4.5 percent in December 2025 to 4.3 percent in February 2026.
It then climbed sharply, reaching 5.6 percent in April and 6.7 percent in May 2026.
The May rise reflected higher energy prices and transport costs during elevated global oil prices.
Core inflation rose to 3.2 percent in May 2026, while non-core inflation jumped to 16.0 percent.
This split exposes Kenya’s vulnerability to imported fuel and food shocks even when domestic demand stays soft.
The shilling’s tight trading band
The Kenyan shilling has been the quiet anchor of the macro story in 2026.
On December 31, 2025, it traded at KSh 129.01 per US dollar.
By July 23, 2026, it stood at KSh 129.53, after moving between KSh 128.99 and KSh 129.99 over the period.
On September 4, 2026, the Central Bank of Kenya’s own rate put the dollar at KSh 129.47, still inside that band.
The Central Bank of Kenya (CBK), the country’s monetary authority, repeatedly described the shilling as stable against major international and regional currencies.
Investors should read this as managed stability rather than a freely floating market outcome.
The current account deficit, estimated at 2.4 percent of GDP in 2025 and 2.2 percent in 2026, supports the balance.
However, about 59.7 percent of external debt was in US dollars as of June 2025. This keeps demand for hard currency alive.
Forex reserves provide a fragile cushion
Kenya’s foreign exchange reserves stood at US$12,394 million on December 31, 2025, equal to 5.3 months of import cover.
They rose to US$13,655.70 million by April 2, 2026, reaching 5.8 months of import cover.
By June 25, the reserve stock had eased to US$13,173 million, still covering 5.6 months of imports.
The Central Bank’s statutory requirement is at least four months of import cover, so the buffer remains compliant.
In the week ending July 23, 2026, reserves fell by about KSh 40 billion, equivalent to about US$309 million.
That one-week move shows how quickly cash can shift when dollar demand rises.
Reserves are adequate for now, but they are no substitute for reducing external debt pressure.
Policy rate cuts meet sticky available cash
The Central Bank cut its benchmark policy rate from 9.25 percent in November 2025 to 9.00 percent in December 2025. It cut further, to 8.75 percent, by August and September 2026.
The Kenya Shilling Overnight Interbank Average Rate, known as KESONIA, stood at 8.75 percent in May and June 2026.
Commercial banks’ excess reserves above the 3.25 percent cash reserve ratio averaged KSh 6 billion, about US$46 million. That was for the week ending May 21, 2026.
They had averaged KSh 18.0 billion, about US$140 million, above the requirement in the first week of January 2026.
The interbank rate indicates that available cash remains reasonably priced despite fiscal pressures.
Softer policy is meant to support credit growth, but private sector borrowing still faces crowding-out from government financing.
IMF programme and the next cheque
The International Monetary Fund, known as the IMF, is the global lender that helps countries manage balance-of-payments and debt problems.
The IMF disbursed about US$606 million to Kenya on October 30, 2024. That followed completion of the programme’s seventh and eighth reviews.
Kenya then missed the ninth and final review in early 2025, and the two sides agreed not to proceed with it.
That decision forfeited about US$850.9 million Kenya would otherwise have received, according to IMF and government statements at the time.
Kenya has since asked the IMF for an entirely new programme, and talks continued through 2026 without a finished deal.
Central Bank of Kenya Governor Kamau Thugge said in August 2026 that discussions on a fresh IMF-supported programme were still under way.
No new loan amount, staff-level agreement or board approval date had been confirmed as of September 2026.
IMF engagement still matters, because a completed deal would anchor the credibility of Kenya’s consolidation plans with other lenders.
Debt service eats into tax revenue
Kenya’s public and publicly guaranteed debt is estimated at 74.8 percent of GDP at the end of the 2025/26 fiscal year.
That is down slightly from a peak of 77.2 percent in the 2023/24 fiscal year.
The IMF has classified Kenya’s debt as at high risk of distress.
External debt service costs consume nearly 32 percent of tax revenues in the year ending June 2026.
Almost one in three shillings collected in tax goes to foreign creditors.
Kenya also bought back part of its Eurobond debt in February 2026, spending about KSh 64.4 billion, about US$500 million.
The buyback smoothed Kenya’s repayment schedule rather than adding fresh borrowing.
Fiscal deficit targets and the wage bill
The Treasury aims to cut the fiscal deficit to 3.5 percent of GDP in the 2026/27 budget.
That is down from 4.9 percent of GDP in the previous 2025/26 fiscal year.
Kenya’s tax-to-GDP ratio stands at 16.8 percent, below the sub-Saharan Africa average of 18.5 percent.
The IMF recommends improved compliance, digital tax administration and fewer VAT refund leakages.
Public wages absorb about 7.5 percent of GDP.
Treasury Cabinet Secretary John Mbadi has described the road ahead as demanding, highlighting constraints before the 2027 elections.
Tax protests remain a political brake
The 2024 finance bill sought to raise KES 346 billion, about US$2.68 billion at 2024 rates. The plan relied on VAT hikes and other tax measures.
Mass protests, led largely by young Kenyans known as the Gen Z protest movement, opposed the tax package.
President William Ruto eventually refused to sign the bill, effectively shelving the proposed tax increases.
The protests were driven by frustration over austerity measures and new taxation.
The government is now cautious about introducing levies perceived as regressive.
That political constraint directly limits how quickly Kenya can close its fiscal deficit before the 2027 vote.
Nairobi as an expat and tech hub
Nairobi remains East Africa’s main hub for expatriates and technology firms. Its edge is regional connectivity, a skilled English-speaking workforce and established financial services.
A stable shilling reduces expat and investor uncertainty on rental and salary costs. Rising fuel and transport costs, though, push up living expenses.
For investors, Nairobi offers regional market access, but also exposure to sovereign debt pressure and election-year politics.
More: Kenya news in English, every day from The Rio Times.
The big picture: Kenya explained — economy, politics, society and daily life in one read.
What investors should watch into 2027
First, watch whether headline inflation eases below 5 percent after the May 2026 spike to 6.7 percent.
Second, monitor whether Kenya and the IMF reach a new staff-level agreement, since the last programme lapsed in 2025 without one.
Third, track the fiscal deficit path from 4.9 percent toward the 3.5 percent target in 2026/27.
Fourth, follow the shilling’s band; a break above KSh 130 could signal dollar scarcity or reserve stress.
Fifth, watch election-related spending promises as the 2027 campaign approaches.
The combination of high debt service, a wafer-thin tax base and political resistance to new levies remains Kenya’s central risk.
Connected Coverage
Kenya Overtakes Nigeria as Africa’s Biggest Market for Deals
Eight Million Kilos of Kenyan Tea Are Stuck in Mombasa
I&M Group Cleared US$79 Million, Led by Rwanda and Uganda
The Big Picture
More from the Kenya section
Latest developments
- Zanzibar Halts Stone Town Hotel Building on 9 October — 11 October 2026
- Kenya Warns 1.5 Million at Risk From El Niño Rains — 11 October 2026
- Ethiopia Names 62 State Ministers, New Investment Head — 11 October 2026
- Djibouti Rises to Tier 2 in US Trafficking Report — 10 October 2026
This article was produced by The Rio Times’ automated newsroom system. How we use AI · Report an error · Editorial responsibility: Matthias Camenzind, Editor-in-Chief
LatAm Markets: Live Signals → — real-time movers, turnover leaders and FX across Latin America.
Expat Guide to Kenya
What The Rio Times publishes for foreigners who live in or move to Kenya.
Start here
- Best Places to Live in Kenya for Expats 2026
- Phone Line and Internet in Kenya for Foreigners 2026
- Is Kenya Safe in 2026? US Level 2 Advisory, Crime Down 5.1%
- Moving to Kenya: US$30 Travel Authorisation, Work Permit Costs 500,000 Shillings a Year
City guides
Coming up in Kenya
- Kenya Hosts Four-Day Kisima Wellbeing Festival in Kilifi, 16-19 October 19 Oct
- Mashujaa Day 2026: 20 October Holiday, Eldoret, US Visitors 20 Oct
- Ne-Yo in Nairobi on 20 October, Gold Tickets US$116 20 Oct
- Mombasa Events 12 to 31 October 2026 24 Oct
Understand Kenya