IBOV 185,229.17 ▼ 0.41% IPSA 11,381.18 ▲ 1.30% IPC MEX 63,375.93 ▼ 0.78% MERVAL 3,021,926 ▼ 1.29% COLCAP 2,548.22 ▲ 1.05% BVL PERÚ 60,023.65 ▼ 1.13% USD/BRL5.14▲ 0.26% USD/MXN17.22▲ 0.30% USD/CLP959.00▼ 0.31% USD/COP3,175▲ 1.37% USD/PEN3.37▼ 0.10% USD/ARS1,514▲ 0.26% USD/UYU40.16▲ 2.90% USD/PYG5,906▲ 2.95% USD/BOB9.95▼ 6.56% USD/DOP58.83▲ 0.22% USD/CRC444.45▲ 2.49% USD/GTQ7.63▲ 3.03% USD/HNL26.85▲ 0.38% USD/NIO36.62▲ 2.64% USD/VES846.42▼ 0.13% USD/PAB1.00— 0.00% USD/BZD2.00— 0.00% USD/JMD 157.28 — 0.00% USD/TTD6.75▲ 2.57% EUR/BRL5.91▲ 0.04% BRENT 88.88 ▼ 0.03% WTI 83.11 ▼ 0.11% IRON ORE 161.91 — — COPPER 6.61 ▲ 0.03% GOLD 4,461 ▲ 1.78% SILVER 65.59 ▲ 1.26% SOY 1,184 ▲ 3.20% CORN 480.50 ▲ 10.02% WHEAT 655.00 ▲ 3.93% COFFEE 317.25 ▼ 5.51% SUGAR 16.43 ▼ 1.79% ORANGE JUICE 138.55 ▼ 0.47% COTTON 85.03 ▲ 2.33% COCOA 5,719 ▲ 3.18% BEEF 223.60 ▼ 3.93% CATTLE 339.10 ▼ 3.16% LITHIUM 75.20 ▲ 1.47% PETR4 41.64 ▼ 0.05% VALE3 72.97 ▲ 0.83% ITUB4 38.60 ▼ 1.03% BBDC4 16.85 ▲ 0.36% ABEV3 14.89 ▼ 0.80% BBAS3 19.37 ▲ 0.47% B3SA3 14.26 ▼ 0.21% WEGE3 47.59 ▲ 0.49% PRIO3 59.14 ▼ 0.19% SUZB3 41.33 ▲ 2.35% RENT3 34.68 ▼ 0.09% AZZA3 15.89 ▼ 2.63% CSAN3 3.22 ▼ 1.83% RAIZ4 0.25 — 0.00% PCAR3 2.75 ▼ 0.36% GMAT3 3.65 ▼ 1.08% PSSA3 48.13 ▼ 0.54% CVCB3 1.33 ▼ 2.92% POSI3 3.36 ▲ 2.44% SLCE3 13.34 ▲ 0.30% NATU3 8.14 ▼ 0.73% IBOV 185,229.17 ▼ 0.41% IPSA 11,381.18 ▲ 1.30% IPC MEX 63,375.93 ▼ 0.78% MERVAL 3,021,926 ▼ 1.29% COLCAP 2,548.22 ▲ 1.05% BVL PERÚ 60,023.65 ▼ 1.13% USD/BRL 5.16 ▲ 0.01% USD/MXN 17.06 ▼ 0.24% USD/CLP 913.98 ▲ 0.04% USD/COP 3,140 ▲ 0.03% USD/PEN 3.36 ▼ 0.66% USD/ARS 1,493 ▲ 0.10% USD/UYU 40.27 ▲ 1.24% USD/PYG 5,939 ▲ 1.68% USD/BOB 11.64 ▼ 0.76% USD/DOP 58.34 ▲ 1.25% USD/CRC 445.92 ▲ 0.89% USD/GTQ 7.62 ▲ 2.21% USD/HNL 26.79 ▲ 1.57% USD/NIO 36.62 ▲ 0.69% USD/VES 762.44 ▼ 0.13% USD/PAB 1.00 — 0.00% USD/BZD 2.00 — 0.00% USD/JMD 157.28 — 0.00% USD/TTD 6.70 ▲ 0.61% EUR/BRL 5.95 ▲ 1.01% BRENT 88.88 ▼ 0.03% WTI 83.11 ▼ 0.11% IRON ORE 161.91 — — COPPER 6.61 ▲ 0.03% GOLD 4,461 ▲ 1.78% SILVER 65.59 ▲ 1.26% SOY 1,184 ▲ 3.20% CORN 480.50 ▲ 10.02% WHEAT 655.00 ▲ 3.93% COFFEE 317.25 ▼ 5.51% SUGAR 16.43 ▼ 1.79% ORANGE JUICE 138.55 ▼ 0.47% COTTON 85.03 ▲ 2.33% COCOA 5,719 ▲ 3.18% BEEF 223.60 ▼ 3.93% CATTLE 339.10 ▼ 3.16% LITHIUM 75.20 ▲ 1.47% PETR4 41.64 ▼ 0.05% VALE3 72.97 ▲ 0.83% ITUB4 38.60 ▼ 1.03% BBDC4 16.85 ▲ 0.36% ABEV3 14.89 ▼ 0.80% BBAS3 19.37 ▲ 0.47% B3SA3 14.26 ▼ 0.21% WEGE3 47.59 ▲ 0.49% PRIO3 59.14 ▼ 0.19% SUZB3 41.33 ▲ 2.35% RENT3 34.68 ▼ 0.09% AZZA3 15.89 ▼ 2.63% CSAN3 3.22 ▼ 1.83% RAIZ4 0.25 — 0.00% PCAR3 2.75 ▼ 0.36% GMAT3 3.65 ▼ 1.08% PSSA3 48.13 ▼ 0.54% CVCB3 1.33 ▼ 2.92% POSI3 3.36 ▲ 2.44% SLCE3 13.34 ▲ 0.30% NATU3 8.14 ▼ 0.73%
since 2009
Saturday, September 19, 2026

Green Deal 2.0: Europe’s Risky Gamble as Industry Eyes the Exit

By · February 27, 2025 · 2 min read

The LatAm Brief

One email, every weekday morning. What moved in Latin American markets, politics and expat life.

Yesterday’s subject line: “Bolivia's 83% fuel shock, hours after the IMF loan”

Free. We send a confirmation link first — nothing arrives until you click it. Unsubscribe with one click in any edition. If you stop opening us for 30 days we stop sending by ourselves, as we assume the interest is no longer there. See our privacy policy. We never share your email.

(Analysis) The European Union has unveiled its Green Deal 2.0, a bold plan to decarbonize industry, simplify regulations, and attract investments.

With measures like the €100 billion Industrial Decarbonization Bank and the Carbon Border Adjustment Mechanism (CBAM), the EU aims to save €6.3 billion annually in administrative costs and mobilize €50 billion in public and private investments.

But as Europe doubles down on its climate ambitions, a critical question arises: is this the final push that will drive its industries to flee to more business-friendly shores like the United States?

The Green Deal 1.0, launched in 2019, was intended to position Europe as a leader in green technologies while reducing emissions by 55% by 2030. Instead, it became a cautionary tale.

China capitalized on Europe’s green ambitions, dominating supply chains for solar panels, batteries, and electric vehicles. European manufacturers, unable to compete with China’s scale and subsidies, lost market share across key sectors.
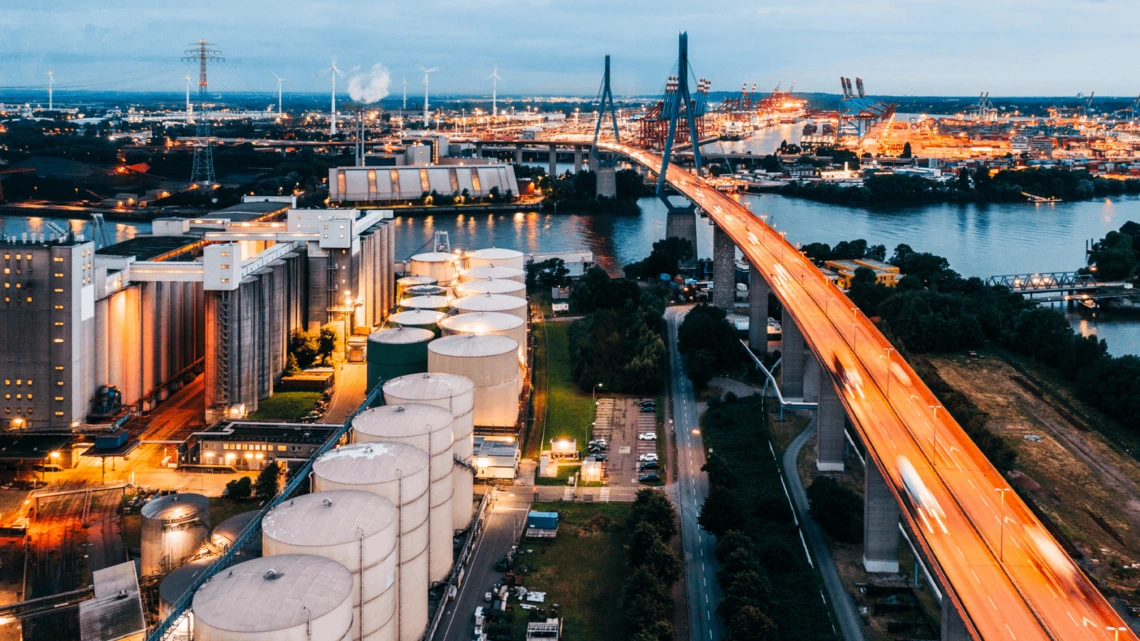
Green Deal 2.0: Europe’s Risky Gamble as Industry Eyes the Exit
Green Deal 2.0: Europe’s Risky Gamble as Industry Eyes the Exit.
One-stop reference
Company Intelligence
Every listed company in Latin America — financials, ownership and structure for 1,450+ companies across 26 exchanges, in one place.
Browse the directory →
RT
Ask Rio Times
17 years of Latin America reporting, on demand.
Open the full Ask Rio Times →

By 2023, Chinese companies produced 85% of the world’s solar cells and controlled 97% of silicon wafer production—industries once pioneered by Europe.

Europe’s Struggle with Industrial Erosion

This industrial erosion left Europe heavily dependent on Chinese imports for its green transition while struggling with soaring energy costs and regulatory burdens.

High electricity prices—up to three times higher than in the U.S.—further weakened European competitiveness. Yet, rather than reassess its strategy, Europe now appears to be doubling down with Green Deal 2.0.

Meanwhile, across the Atlantic, Donald Trump’s second presidency has taken a starkly different approach. Trump has dismissed climate policies as a “scam,” rolling back environmental regulations and slashing corporate taxes.

U.S. firms now operate with fewer constraints, benefiting from lower energy costs and Trump’s deregulatory agenda. This divergence creates an uneven playing field: while European industries face rising compliance costs under CBAM and other regulations, U.S. firms enjoy unshackled growth.

The EU’s reliance on CBAM to protect its industries raises further concerns. While it aims to level the playing field by taxing carbon-intensive imports, it risks inflating costs for European businesses already grappling with global competition.

Critics argue that these policies could accelerate deindustrialization as manufacturers relocate to countries like the U.S., where operating conditions are more favorable.

Europe’s industrial future hangs in the balance. The Green Deal 2.0 promises long-term sustainability but risks exacerbating short-term economic pain.

As China consolidates its dominance in green technologies and U.S. firms thrive under deregulation, Europe must confront an uncomfortable reality: its climate ambitions may come at the cost of its industrial base. Whether this gamble pays off or backfires will shape Europe’s economic trajectory for decades to come.

This article was produced by The Rio Times’ automated newsroom system. How we use AI · Report an error

Read More from The Rio Times

The Rio Times · Power Map
See who really holds power in Latin America
Click to open the Power Map

Rotate for Best Experience

This report is optimized for landscape viewing. Rotate your phone for the full experience.