Key Facts
- Corn jumped 1.10% to US$19.22 on the CORN tracker after Friday’s Pro Farmer estimate cut the US yield to 173.2 bu/acre, down 7.5 bu from the USDA figure of 180.7 bu/acre, implying roughly 670 million fewer bushels.
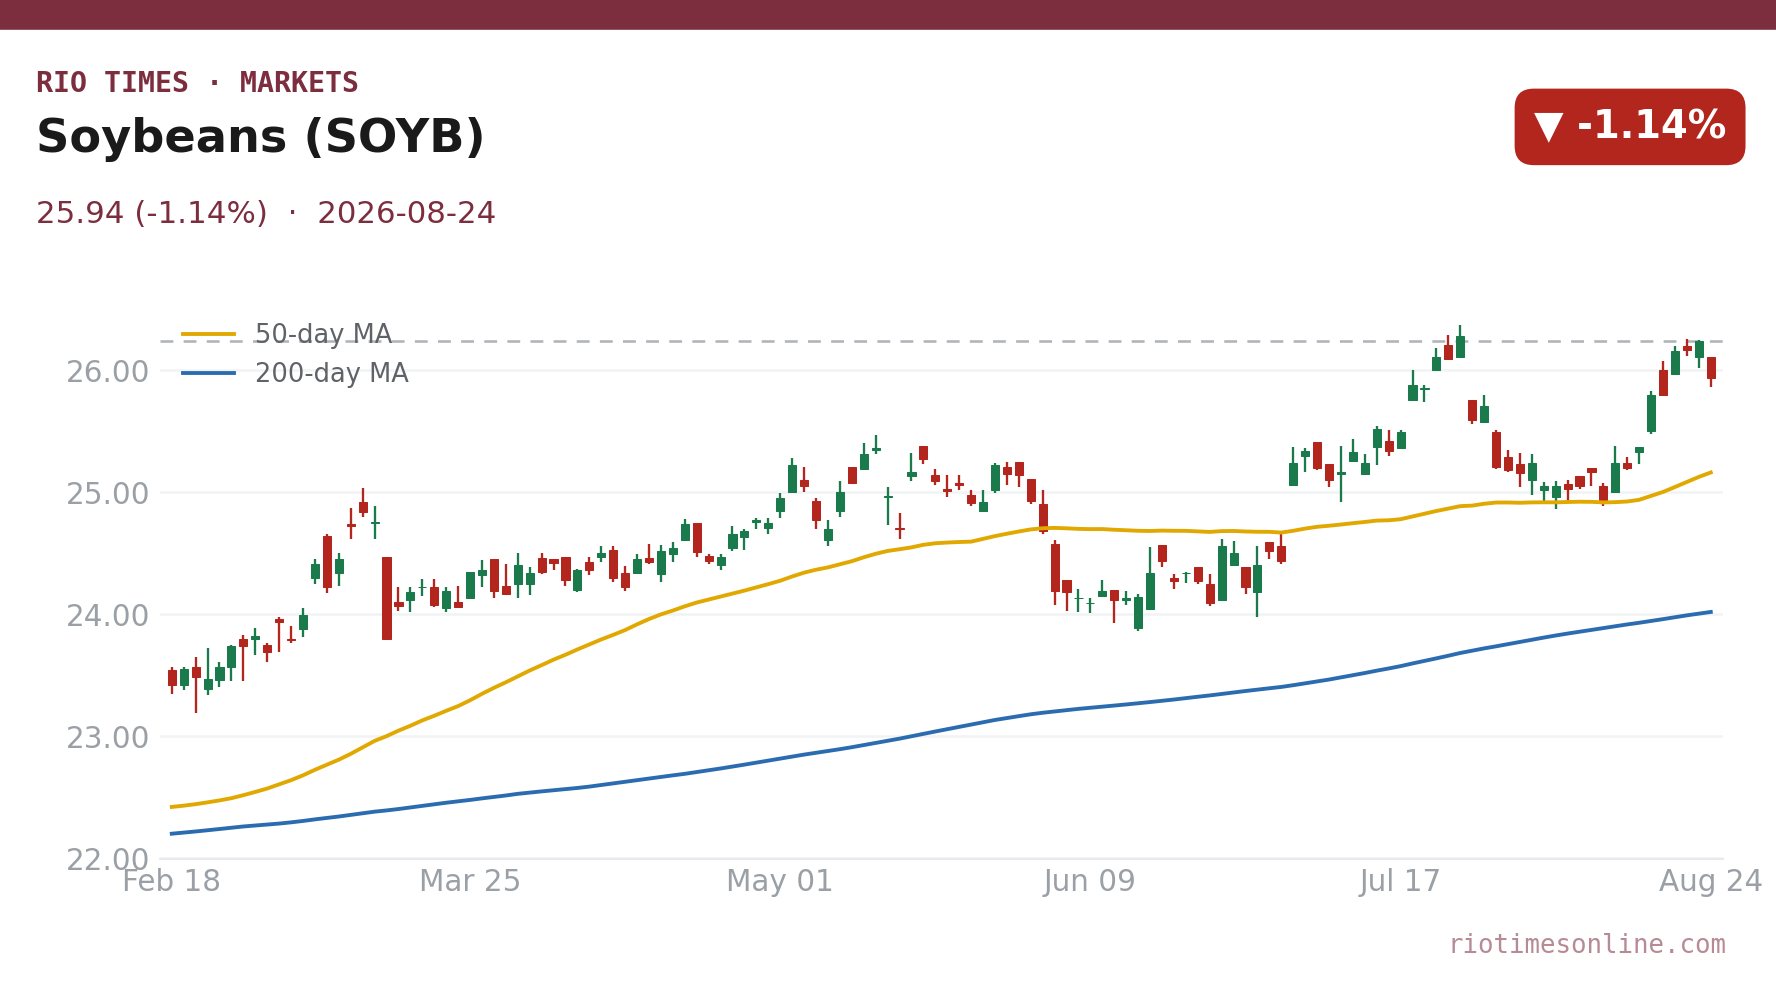
- Soybeans slipped 1.14% to US$25.94 on the SOYB tracker even as China booked 712,000 tonnes and unknown destinations another 720,000 tonnes for 2026/27 delivery, underscoring strong export demand.
- Wheat added 0.28% to US$25.48 on the WEAT tracker after Ukrainian strikes on Russia’s Novorossiysk grain export terminals disrupted Black Sea shipping, with SovEcon projecting August Russian exports of just 3.0-3.4 million tonnes versus a five-year average of 5 million.
- Brazil’s 2026/27 corn production was held at 139 million tonnes by the USDA while Argentina’s was maintained at 55 million tonnes, with Brazil bids essentially flat month to month and Argentine bids down US$1 to US$206/ton on heavy harvest moisture.
- The USDA kept Brazil’s soybean production at 186 million tonnes and Argentina’s at 50 million tonnes for the 2026/27 cycle, reinforcing Latin America’s role as the world’s export engine despite weather disruptions.
Today’s Focus
Corn led the grain complex higher on Monday, August 24, 2026, as the Pro Farmer Crop Tour slashed its US yield estimate to 173.2 bu/acre, down 7.5 bu from the USDA’s August figure of 180.7 bu/acre. That cut implies roughly 670 million fewer bushels of American production.
Soybeans fell 1.14% despite fresh Chinese buying of 712,000 tonnes and another 720,000 tonnes to unknown destinations for 2026/27 delivery, suggesting traders had already priced in robust export demand.
Wheat firmed modestly after Ukrainian strikes hit Russia’s Novorossiysk grain terminals, with SovEcon warning Russian August exports could fall to 3.0-3.4 million tonnes, well below the five-year average of 5 million.
For Brazil and Argentina, the USDA held production estimates steady, leaving Latin America positioned to capture any price premium from American supply fears.
What matters today. US yield uncertainty is handing pricing power to Brazilian and Argentine exporters just as Black Sea disruption tightens wheat supply.
01 The session in one read
Corn rallied hard on Monday, August 24, 2026, after the Pro Farmer Crop Tour cut its US yield estimate to 173.2 bu/acre, a full 7.5 bushels below the USDA’s August figure of 180.7 bu/acre. The implied loss of roughly 670 million bushels of production jolted traders who had expected American fields to cushion any global shortfall.
Soybeans, by contrast, slipped 1.14% as profit-taking set in despite news that China booked 712,000 tonnes and unknown destinations another 720,000 tonnes for 2026/27 delivery. Wheat added a quiet 0.28% after Ukrainian strikes on Russia’s Novorossiysk export terminals raised fresh doubts about Black Sea shipping.
The corn market is repricing American supply risk after the Pro Farmer tour found materially lower yields than USDA assumptions. With 670 million fewer bushels implied, the buffer against a poor Brazilian or Argentine finish has thinned, leaving global buyers more exposed to Latin American weather. Watch the USDA’s next World Agricultural Supply and Demand Estimates report for whether it follows the tour’s yield cut.
02 The board
The CORN tracker settled at US$19.22, up 1.10%, leading the grain complex higher. The WEAT wheat tracker finished at US$25.48, a gain of 0.28%, while the SOYB soybean tracker fell 1.14% to US$25.94.
The divergence between corn and soybeans tells the story: supply fear is beating demand optimism. Corn’s rally is about what might not be harvested, while soybeans slipped even as export bookings piled up, a sign that traders had already priced the demand story into the market.
| Asset | Level | Change |
|---|---|---|
| Soybeans (SOYB) | US$25.94 | -1.14% |
| Corn (CORN) | US$19.22 | +1.10% |
| Wheat (WEAT) | US$25.48 | +0.28% |
Source: RT close, 2026-08-24. Where a commodity has no spot feed, an exchange-traded tracker or leading producer is shown as a labelled proxy.
Live Market IntelligenceThe live market board
Rio Times · Live Market Intelligence
Latin America — Cross-Market Board
| Instrument | Last | Change | YoY | Prev. | High | Low | Volume |
|---|---|---|---|---|---|---|---|
| IBOV | 206,220.24 | +0.94% | +21.85% | 204,302.33 | 168,310 | 167,142 | — |
| IPSA | 11,024.22 | +0.22% | — | 10,999.64 | 11,210 | 10,984 | 1,513,213,483 |
| IPC MEX | 64,986.91 | +0.52% | +12.17% | 64,653.33 | 66,121 | 65,405 | 108,886,187 |
| MERVAL | 2,832,472 | +0.00% | +30.51% | 3,022,485 | 3,042,365 | 2,991,150 | — |
| COLCAP | 2,525.90 | -0.36% | — | 9.04 | 9.05 | 9.02 | 4,133 |
| BVL PERÚ | 60,766.81 | -1.71% | — | — | — | — | — |
| USD/BRL | 5.16 | +0.01% | -5.13% | 5.16 | 5.18 | 5.14 | — |
| EUR/BRL | 5.95 | +1.01% | -5.83% | 5.89 | 5.98 | 5.94 | — |
| USD/MXN | 17.06 | -0.24% | -8.58% | 17.10 | 17.08 | 17.01 | — |
| USD/CLP | 913.98 | +0.04% | -5.67% | 913.65 | 915.11 | 906.68 | — |
| USD/COP | 3,140 | +0.03% | -22.04% | 3,139 | 3,141 | 3,105 | — |
| USD/PEN | 3.36 | -0.66% | -4.82% | 3.38 | 3.38 | 3.35 | — |
| USD/ARS | 1,493 | +0.10% | +12.96% | 1,491 | 1,494 | 1,480 | — |
| USD/UYU | 40.27 | +1.24% | +1.80% | 39.77 | 40.27 | 40.23 | — |
| USD/PYG | 5,939 | +1.68% | -19.54% | 5,841 | 5,939 | 5,925 | — |
| USD/BOB | 11.64 | -0.76% | +72.04% | 11.73 | 11.72 | 11.64 | — |
| USD/DOP | 58.34 | +1.25% | -3.44% | 57.62 | 58.34 | 58.04 | — |
| USD/CRC | 445.92 | +0.89% | -9.71% | 441.97 | 448.50 | 445.92 | — |
03 What moved it
The Pro Farmer tour was the session’s pivotal event. Its corn yield estimate of 173.2 bu/acre, down 7.5 bushels from the USDA’s August figure of 180.7 bu/acre, implies roughly 670 million fewer bushels than the agency had modelled.
For wheat, Ukrainian strikes on Russia’s Novorossiysk grain export terminals disrupted Black Sea loading, and SovEcon projected Russian August exports at 3.0-3.4 million tonnes, sharply below the five-year average of 5 million tonnes. That tightens a market already nervous about European weather.
04 The Latin American read
Brazil and Argentina are the direct beneficiaries of any sustained US supply scare. The USDA held Brazil’s 2026/27 corn production at 139 million tonnes and Argentina’s at 55 million tonnes, with Brazil bids essentially flat month to month and Argentine bids down just US$1 to US$206/ton on heavy harvest moisture.
For soybeans, the USDA kept Brazil at 186 million tonnes and Argentina at 50 million tonnes. A record Argentine crop is pressuring bids, but heavy moisture slowing harvest is keeping near-term supply from flooding the market, supporting the export-competitiveness link between weather, harvest pace and price.
05 The names to watch
The currency channel remains a quiet but powerful force. The Brazilian real closed Monday at 5.1531 per US dollar, 0.27% weaker on the day, and a softer real makes Brazilian beans and corn cheaper for foreign buyers holding dollars.
Brazil’s flat bids and Argentina’s mild US$1 dip to US$206/ton suggest exporters are holding firm despite the record Argentine crop, betting that global buyers will pay up if US yields keep disappointing. Watch whether Argentine harvest progress accelerates and lets cheaper supply reach ports.
06 The outlook
The grain complex now hinges on whether the USDA validates the Pro Farmer yield cut in its next supply and demand report. If it does, corn’s supply premium could extend, dragging wheat higher on spillover buying and giving soybeans a floor despite the session’s dip. For Brazil and Argentina, every bushel of uncertainty in the US is a potential pricing windfall.
07 What to watch
- USDA September WASDE: Whether the agency follows the Pro Farmer yield cut or holds at 180.7 bu/acre for corn, defining the size of the supply hole.
- Black Sea terminal strikes: Any confirmed damage to Novorossiysk infrastructure could further cut Russian wheat exports and lift global wheat premiums.
- Argentine harvest pace: Heavy moisture is slowing movement of a record crop; faster drying would release cheaper supply and pressure bids.
- China’s soybean bookings: Sustained large purchases for 2026/27 delivery would validate demand and narrow the spread between soybeans and corn.
Frequently Asked Questions
Why did corn rally while soybeans fell?
Pro Farmer cut US corn yield estimates sharply, implying 670 million fewer bushels, while soybeans saw profit-taking despite strong Chinese export bookings.
How does this affect Brazil and Argentina?
With US supply in doubt, global buyers lean more on South American exporters, giving Brazil and Argentina pricing power despite their own weather issues.
What happened to wheat?
Ukrainian strikes on Novorossiysk disrupted Russian export terminals, and SovEcon projected August Russian exports well below the five-year average.
Why does the exchange rate matter for grains?
Grain is priced in US dollars, so when the Brazilian real or Argentine peso weakens, local farmers earn more per tonne and their exports get cheaper for foreign buyers.
This article was produced by The Rio Times’ automated newsroom system. How we use AI · Report an error · Editorial responsibility: Matthias Camenzind, Editor-in-Chief
LatAm Markets: Live Signals → — real-time movers, turnover leaders and FX across Latin America.