
Key Facts
- Wheat hit a three-year high as winter wheat futures in Chicago pushed to their strongest levels since 2023 on Black Sea supply fears, and the wheat-tracking fund WEAT added 0.85% to US$27.22.
- Corn slipped with the corn-tracking fund CORN down 1.15% to US$19.80, pausing after its own run to three-year highs earlier in the week.
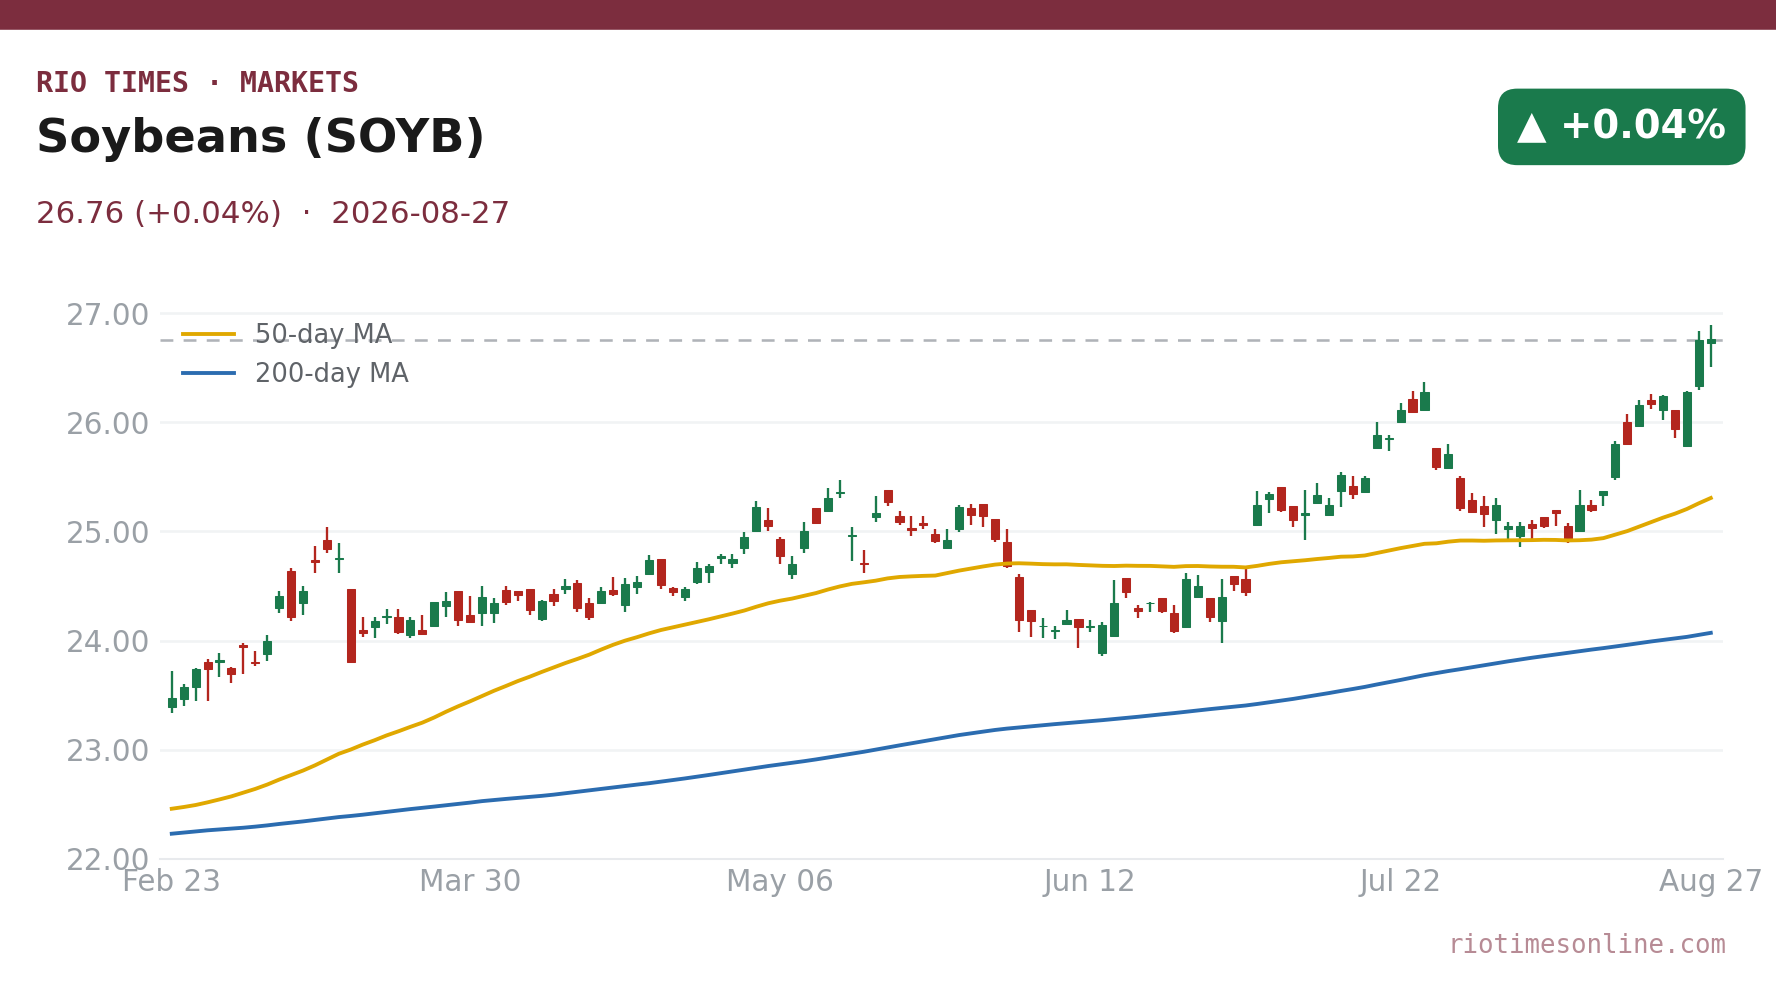
- Soybeans held firm as the soybean-tracking fund SOYB edged up 0.04% to US$26.76, supported by steady Chinese demand for oilseeds.
- Black Sea supply risk drove the day with Russian and Ukrainian grain exports shrinking as the war escalates, forcing importers to pay up for wheat.
- Currency link matters because Brazilian and Argentine farm returns hinge on dollar-priced futures and the real and peso exchange rates.
Today’s Focus
Wheat seized the headlines on Thursday, August 27, 2026, as the escalating Russia-Ukraine war threatened to choke off more Black Sea export flows. Chicago winter wheat futures pushed to three-year highs, and the wheat-tracking fund WEAT climbed 0.85% to US$27.22.
Soybeans held firm, with the soybean-tracking fund SOYB up a marginal 0.04% to US$26.76 on steady Chinese buying. Brazil and Argentina, the world’s soybean export engine, remain the key beneficiaries.
Corn was the session’s laggard. The corn-tracking fund CORN slipped 1.15% to US$19.80, pausing after hitting three-year highs earlier in the week as the US harvest ran ahead of schedule.
What matters today. Black Sea war risk is reshaping global grain flows, pushing wheat higher while corn takes a breather and soybeans stay firm on Chinese buying.
01 The session in one read
Wheat stole the show on Thursday, August 27, 2026, as the Russia-Ukraine war escalated and threatened further damage to Black Sea grain exports. Winter wheat futures in Chicago reached their highest levels in three years, and the wheat-tracking fund WEAT rose 0.85% to US$27.22.
Soybeans managed a firm finish, with the soybean-tracking fund SOYB ticking up 0.04% to US$26.76. Chinese buyers continued to favour oilseeds over feed grains.
Corn was the odd one out, with the corn-tracking fund CORN falling 1.15% to US$19.80. Feed grains took a breather after corn futures made three-year highs of their own on Wednesday.
The wheat rally is driven by concrete supply disruption from the Black Sea, not speculation, which gives it legs. Corn’s decline looks like a pause rather than a reversal, with Brazilian and Argentine export programs still priced in dollars. The variable to watch is whether Black Sea export volumes recover quickly.
02 The board
The soybean-tracking fund SOYB settled at US$26.76, up 0.04%, holding the line after recent gains. The corn-tracking fund CORN dropped 1.15% to US$19.80, a clear pullback from its climb above US$20 earlier in the week.
Wheat was the standout, with the wheat-tracking fund WEAT rising 0.85% to US$27.22. The move reflected a market repricing Russian and Ukrainian export risk as the war deepened.
These are exchange-traded funds that hold futures contracts, quoted in dollars per share. They track — but are not identical to — the price of grain futures in Chicago.
| Asset | Level | Change |
|---|---|---|
| Soybeans (SOYB fund) | US$26.76 | +0.04% |
| Corn (CORN fund) | US$19.80 | -1.15% |
| Wheat (WEAT fund) | US$27.22 | +0.85% |
Source: RT close, 2026-08-27. Where a commodity has no spot feed, an exchange-traded tracker or leading producer is shown as a labelled proxy.
Live Market IntelligenceThe live market board
Rio Times · Live Market Intelligence
Latin America — Cross-Market Board
| Instrument | Last | Change | YoY | Prev. | High | Low | Volume |
|---|---|---|---|---|---|---|---|
| IBOV | 206,756.11 | -1.11% | +21.85% | 209,066.90 | 168,310 | 167,142 | — |
| IPSA | 10,974.58 | -0.62% | — | 11,043.36 | 11,210 | 10,984 | 1,513,213,483 |
| IPC MEX | 66,746.78 | +1.06% | +12.17% | 66,048.57 | 66,121 | 65,405 | 108,886,187 |
| MERVAL | 2,883,107 | +1.95% | +30.51% | 3,022,485 | 3,042,365 | 2,991,150 | — |
| COLCAP | 2,555.55 | +0.96% | — | 9.04 | 9.05 | 9.02 | 4,133 |
| BVL PERÚ | 60,645.95 | -0.68% | — | — | — | — | — |
| USD/BRL | 5.16 | +0.01% | -5.13% | 5.16 | 5.18 | 5.14 | — |
| EUR/BRL | 5.95 | +1.01% | -5.83% | 5.89 | 5.98 | 5.94 | — |
| USD/MXN | 17.06 | -0.24% | -8.58% | 17.10 | 17.08 | 17.01 | — |
| USD/CLP | 913.98 | +0.04% | -5.67% | 913.65 | 915.11 | 906.68 | — |
| USD/COP | 3,140 | +0.03% | -22.04% | 3,139 | 3,141 | 3,105 | — |
| USD/PEN | 3.36 | -0.66% | -4.82% | 3.38 | 3.38 | 3.35 | — |
| USD/ARS | 1,493 | +0.10% | +12.96% | 1,491 | 1,494 | 1,480 | — |
| USD/UYU | 40.27 | +1.24% | +1.80% | 39.77 | 40.27 | 40.23 | — |
| USD/PYG | 5,939 | +1.68% | -19.54% | 5,841 | 5,939 | 5,925 | — |
| USD/BOB | 11.64 | -0.76% | +72.04% | 11.73 | 11.72 | 11.64 | — |
| USD/DOP | 58.34 | +1.25% | -3.44% | 57.62 | 58.34 | 58.04 | — |
| USD/CRC | 445.92 | +0.89% | -9.71% | 441.97 | 448.50 | 445.92 | — |
03 What moved it
The single biggest driver was the Black Sea. Russian and Ukrainian grain exports are shrinking, and the market believes more disruption is coming as the war escalates.
Wheat is the most exposed, since Russia and Ukraine are among its largest exporters. Market commentary on Thursday described winter wheat futures pushing to three-year highs as buyers braced for tighter supply.
China’s buying pattern shifted the balance between corn and soybeans. Importers leaned on Brazilian and Argentine soybeans, while corn faced added short-term supply pressure from a US harvest running ahead of schedule.
04 The Latin American read
Brazil and Argentina remain the world’s export engine for soybeans and corn. For local farmers, the crucial link is the US dollar: futures are priced in dollars, so a stronger real or peso squeezes local returns even when dollar prices rise.
Thursday’s firm soybean fund at US$26.76 is welcome news for exporters. But the currency translation will decide how much of that reaches the farm gate, and Argentine growers are watching the peso and export taxes as much as Chicago prices.
05 The names to watch
The exchange-traded funds tracking each commodity are the cleanest way for foreigners to watch the move. SOYB, CORN and WEAT all moved in different directions on Thursday, a sign of how fragmented the grain complex has become.
For investors in company shares, Brazilian and Argentine grain exporters are the natural play on this divergence. Soybean-heavy balance sheets should benefit from Chinese demand, while corn exporters face a softer near-term outlook.
06 The outlook
The most plausible near-term path is continued wheat strength until Black Sea export flows stabilise, which shows no sign of happening quickly. Soybeans should hold firm on Chinese demand, while corn may drift until the next signal from South American weather or US harvest progress.
07 What to watch
- Black Sea export volumes: Any sign of Russian or Ukrainian grain ships leaving port at scale would pressure wheat and ease global supply fears.
- Chinese soybean purchases: Fresh buying from China would confirm the oilseed demand shift and support soybean prices.
- Brazil and Argentina currencies: A stronger real or peso reduces local producer margins and could slow forward selling from South America.
- US corn harvest pace: Faster-than-expected harvest progress could keep corn prices under pressure in the coming weeks.
Frequently Asked Questions
Why did wheat rise on August 27?
The Russia-Ukraine war escalated, threatening more Black Sea export disruption and pushing Chicago winter wheat futures to three-year highs. The wheat-tracking fund WEAT rose 0.85% to US$27.22.
Why did corn fall while wheat rose?
Corn paused after hitting three-year highs earlier in the week, as traders rotated into wheat and soybeans and a faster-than-usual US harvest added supply pressure. The CORN fund fell 1.15% to US$19.80.
What role did China play?
China continued to favour soybean purchases over corn, supporting oilseeds while leaving feed grains softer.
How does this affect Brazil and Argentina?
Both countries are the world’s main soybean and corn exporters, so dollar-priced futures and the real-peso exchange rate determine their actual revenue.
Market data: RT
This article was produced by The Rio Times’ automated newsroom system. How we use AI · Report an error · Editorial responsibility: Matthias Camenzind, Editor-in-Chief
LatAm Markets: Live Signals → — real-time movers, turnover leaders and FX across Latin America.