IBOV 185,990.01 ▼ 0.27% IPSA 11,258.52 ▼ 0.57% IPC MEX 63,507.11 ▼ 1.11% MERVAL 3,051,683 ▼ 0.91% COLCAP 2,523.40 ▼ 1.71% BVL PERÚ 58,496.57 ▲ 1.11% USD/BRL5.15▼ 0.09% USD/MXN17.18▲ 0.20% USD/CLP954.20▼ 0.22% USD/COP3,129▲ 0.46% USD/PEN3.37▲ 0.26% USD/ARS1,512▲ 0.37% USD/UYU40.19▲ 2.94% USD/PYG5,905▲ 1.29% USD/BOB10.10▼ 13.67% USD/DOP58.70▼ 0.17% USD/CRC444.45▲ 1.84% USD/GTQ7.62▲ 2.98% USD/HNL26.85▲ 0.27% USD/NIO36.62▲ 0.29% USD/VES844.40▼ 0.13% USD/PAB1.00— 0.00% USD/BZD2.00— 0.00% USD/JMD 157.28 — 0.00% USD/TTD6.73▲ 2.25% EUR/BRL5.92▼ 0.11% BRENT 88.88 ▼ 0.03% WTI 83.11 ▼ 0.11% IRON ORE 161.91 — — COPPER 6.61 ▲ 0.03% GOLD 4,461 ▲ 1.78% SILVER 65.59 ▲ 1.26% SOY 1,184 ▲ 3.20% CORN 480.50 ▲ 10.02% WHEAT 655.00 ▲ 3.93% COFFEE 317.25 ▼ 5.51% SUGAR 16.43 ▼ 1.79% ORANGE JUICE 138.55 ▼ 0.47% COTTON 85.03 ▲ 2.33% COCOA 5,719 ▲ 3.18% BEEF 223.60 ▼ 3.93% CATTLE 339.10 ▼ 3.16% LITHIUM 75.20 ▲ 1.47% PETR4 41.64 ▼ 0.05% VALE3 72.97 ▲ 0.83% ITUB4 38.60 ▼ 1.03% BBDC4 16.85 ▲ 0.36% ABEV3 14.89 ▼ 0.80% BBAS3 19.37 ▲ 0.47% B3SA3 14.26 ▼ 0.21% WEGE3 47.59 ▲ 0.49% PRIO3 59.14 ▼ 0.19% SUZB3 41.33 ▲ 2.35% RENT3 34.68 ▼ 0.09% AZZA3 15.89 ▼ 2.63% CSAN3 3.22 ▼ 1.83% RAIZ4 0.25 — 0.00% PCAR3 2.75 ▼ 0.36% GMAT3 3.65 ▼ 1.08% PSSA3 48.13 ▼ 0.54% CVCB3 1.33 ▼ 2.92% POSI3 3.36 ▲ 2.44% SLCE3 13.34 ▲ 0.30% NATU3 8.14 ▼ 0.73% IBOV 185,990.01 ▼ 0.27% IPSA 11,258.52 ▼ 0.57% IPC MEX 63,507.11 ▼ 1.11% MERVAL 3,051,683 ▼ 0.91% COLCAP 2,523.40 ▼ 1.71% BVL PERÚ 58,496.57 ▲ 1.11% USD/BRL 5.16 ▲ 0.01% USD/MXN 17.06 ▼ 0.24% USD/CLP 913.98 ▲ 0.04% USD/COP 3,140 ▲ 0.03% USD/PEN 3.36 ▼ 0.66% USD/ARS 1,493 ▲ 0.10% USD/UYU 40.27 ▲ 1.24% USD/PYG 5,939 ▲ 1.68% USD/BOB 11.64 ▼ 0.76% USD/DOP 58.34 ▲ 1.25% USD/CRC 445.92 ▲ 0.89% USD/GTQ 7.62 ▲ 2.21% USD/HNL 26.79 ▲ 1.57% USD/NIO 36.62 ▲ 0.69% USD/VES 762.44 ▼ 0.13% USD/PAB 1.00 — 0.00% USD/BZD 2.00 — 0.00% USD/JMD 157.28 — 0.00% USD/TTD 6.70 ▲ 0.61% EUR/BRL 5.95 ▲ 1.01% BRENT 88.88 ▼ 0.03% WTI 83.11 ▼ 0.11% IRON ORE 161.91 — — COPPER 6.61 ▲ 0.03% GOLD 4,461 ▲ 1.78% SILVER 65.59 ▲ 1.26% SOY 1,184 ▲ 3.20% CORN 480.50 ▲ 10.02% WHEAT 655.00 ▲ 3.93% COFFEE 317.25 ▼ 5.51% SUGAR 16.43 ▼ 1.79% ORANGE JUICE 138.55 ▼ 0.47% COTTON 85.03 ▲ 2.33% COCOA 5,719 ▲ 3.18% BEEF 223.60 ▼ 3.93% CATTLE 339.10 ▼ 3.16% LITHIUM 75.20 ▲ 1.47% PETR4 41.64 ▼ 0.05% VALE3 72.97 ▲ 0.83% ITUB4 38.60 ▼ 1.03% BBDC4 16.85 ▲ 0.36% ABEV3 14.89 ▼ 0.80% BBAS3 19.37 ▲ 0.47% B3SA3 14.26 ▼ 0.21% WEGE3 47.59 ▲ 0.49% PRIO3 59.14 ▼ 0.19% SUZB3 41.33 ▲ 2.35% RENT3 34.68 ▼ 0.09% AZZA3 15.89 ▼ 2.63% CSAN3 3.22 ▼ 1.83% RAIZ4 0.25 — 0.00% PCAR3 2.75 ▼ 0.36% GMAT3 3.65 ▼ 1.08% PSSA3 48.13 ▼ 0.54% CVCB3 1.33 ▼ 2.92% POSI3 3.36 ▲ 2.44% SLCE3 13.34 ▲ 0.30% NATU3 8.14 ▼ 0.73%
since 2009
Wednesday, September 16, 2026

World-News China

Exodus of Wealth: China’s Capital Flees to U.S. Real Estate

By · July 21, 2025 · 2 min read

The LatAm Brief

One email, every weekday morning. What moved in Latin American markets, politics and expat life.

Yesterday’s subject line: “Maduro's money man just pleaded guilty”

Free. We send a confirmation link first — nothing arrives until you click it. Unsubscribe with one click in any edition. If you stop opening us for 30 days we stop sending by ourselves, as we assume the interest is no longer there. See our privacy policy. We never share your email.

A dramatic surge in Chinese investment in U.S. real estate is signaling rising anxiety over China’s economic direction.

According to the National Association of Realtors’ 2025 data, Chinese buyers spent $13.7 billion on American homes between April 2024 and March 2025, purchasing roughly 11,700 properties—an 83% increase over the previous year and accounting for 15% of all foreign home purchases.

The trend is sharply higher than other nations: Canadians were second at $6.2 billion, followed by Mexico ($4.4B), India ($2.2B), and the U.K. ($2B).

Key Data

  • Foreign investors as a whole poured $56 billion into U.S. homes in that period, acquiring 78,100 properties—a 33% jump in value year-over-year.
  • The average Chinese buyer paid over $1.1 million per U.S. home, compared to an average of $719,000 for all foreign buyers, showing a clear preference for high-end real estate.
  • 71% of Chinese buyers used cash, well above the 59% among all foreign purchasers, streamlining transactions and circumventing financial scrutiny.
  • Top destinations for Chinese buyers include California, Maryland, New York, Hawaii, and Georgia. Nevertheless, Florida remains the overall leader for foreign purchases, with 21% of all foreign-bought properties.

Root Causes: Capital Flight and Economic Unease

This torrent of outbound money reflects deep-seated instability within China. Strict rules nominally cap individual overseas transfers at $50,000 per year, yet many buyers find channels to move far more than that, seeking safe havens as China’s economy slows and property defaults mount.

Official growth remains pegged at 5.2%, but rising defaults and plummeting foreign direct investment have triggered real concern among the wealthy and middle class alike.
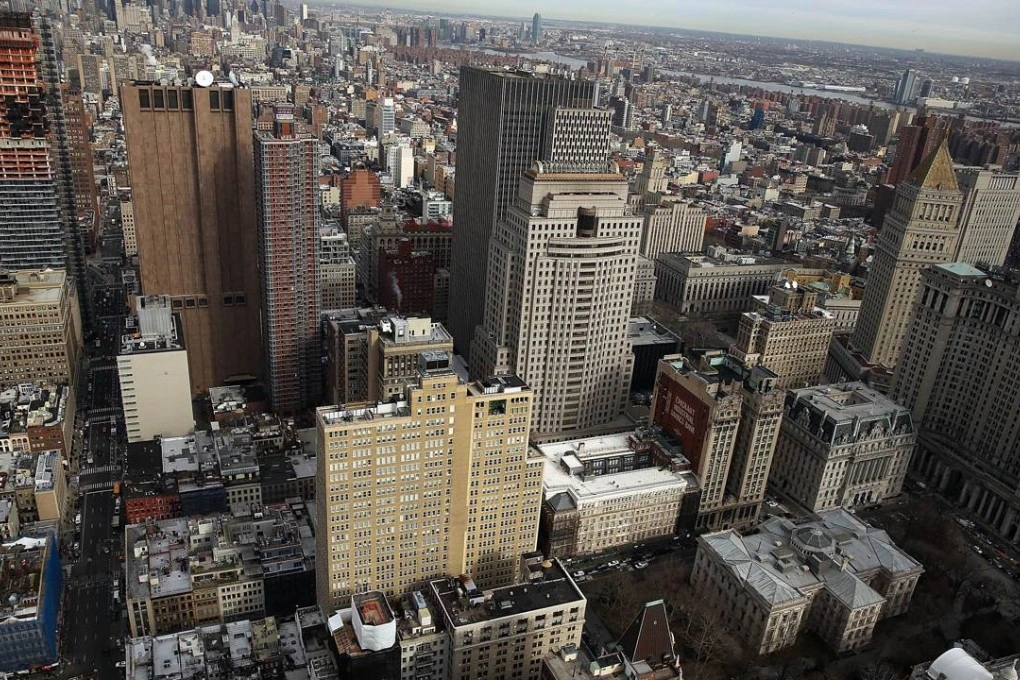
Exodus of Wealth: China’s Capital Flees to U.S. Real Estate
Exodus of Wealth: China’s Capital Flees to U.S. Real Estate.
One-stop reference
Company Intelligence
Every listed company in Latin America — financials, ownership and structure for 1,450+ companies across 26 exchanges, in one place.
Browse the directory →
RT
Ask Rio Times
17 years of Latin America reporting, on demand.
Open the full Ask Rio Times →

Chinese capital outflows now echo the rush seen in the mid-2010s as elites look to protect assets from devaluation and policy risk.

Ripples in the U.S. Market

The influx stimulates the American real estate sector, driving prices up—especially for high-end properties and in key states. Yet, this escalation has sparked debate over housing affordability for local buyers, and some states have responded by limiting foreign, particularly Chinese, ownership in sensitive areas.

On a national level, security officials are increasing reviews of real estate transactions near military bases and critical infrastructure, citing strategic concerns.

Global Stakes

While the U.S. benefits in the short term, economists warn that underlying global instability could have far-reaching effects. The flight of China’s wealthiest, combined with the nation’s internal financial pressures, highlights vulnerabilities with global repercussions.

American business leaders and policymakers are watching closely, balancing the economic boost against the need for safeguards against overdependence on volatile foreign capital flows.

The movement of capital on this scale is more than just a property story—it is a window into China’s economic anxiety, the interplay between globalization and geopolitics, and the challenges facing governments as wealth seeks ever-safer shores.

This article was produced by The Rio Times’ automated newsroom system. How we use AI · Report an error

Read More from The Rio Times

The Rio Times · Power Map
See who really holds power in Latin America
Click to open the Power Map

Rotate for Best Experience

This report is optimized for landscape viewing. Rotate your phone for the full experience.