IBOV 185,500.88 ▼ 0.91% IPSA 11,342.39 ▲ 1.09% IPC MEX 64,216.98 ▲ 0.46% MERVAL 3,084,547 ▼ 0.46% COLCAP 2,588.25 ▼ 0.06% BVL PERÚ 59,184.75 ▼ 0.92% USD/BRL5.15▼ 0.09% USD/MXN17.16▲ 0.10% USD/CLP959.00▲ 1.75% USD/COP3,107▲ 0.51% USD/PEN3.36▼ 0.07% USD/ARS1,508▼ 0.08% USD/UYU40.20▼ 0.15% USD/PYG5,985▲ 1.38% USD/BOB11.45▼ 4.42% USD/DOP58.60▼ 0.42% USD/CRC444.07▼ 0.78% USD/GTQ7.62▼ 0.07% USD/HNL26.85— 0.00% USD/NIO36.62▲ 2.77% USD/VES840.10▼ 0.13% USD/PAB1.00— 0.00% USD/BZD2.00— 0.00% USD/JMD 157.28 — 0.00% USD/TTD6.74▼ 0.08% EUR/BRL5.93▲ 0.17% BRENT 88.88 ▼ 0.03% WTI 83.11 ▼ 0.11% IRON ORE 161.91 — — COPPER 6.61 ▲ 0.03% GOLD 4,461 ▲ 1.78% SILVER 65.59 ▲ 1.26% SOY 1,184 ▲ 3.20% CORN 480.50 ▲ 10.02% WHEAT 655.00 ▲ 3.93% COFFEE 317.25 ▼ 5.51% SUGAR 16.43 ▼ 1.79% ORANGE JUICE 138.55 ▼ 0.47% COTTON 85.03 ▲ 2.33% COCOA 5,719 ▲ 3.18% BEEF 223.60 ▼ 3.93% CATTLE 339.10 ▼ 3.16% LITHIUM 75.20 ▲ 1.47% PETR4 41.64 ▼ 0.05% VALE3 72.97 ▲ 0.83% ITUB4 38.60 ▼ 1.03% BBDC4 16.85 ▲ 0.36% ABEV3 14.89 ▼ 0.80% BBAS3 19.37 ▲ 0.47% B3SA3 14.26 ▼ 0.21% WEGE3 47.59 ▲ 0.49% PRIO3 59.14 ▼ 0.19% SUZB3 41.33 ▲ 2.35% RENT3 34.68 ▼ 0.09% AZZA3 15.89 ▼ 2.63% CSAN3 3.22 ▼ 1.83% RAIZ4 0.25 — 0.00% PCAR3 2.75 ▼ 0.36% GMAT3 3.65 ▼ 1.08% PSSA3 48.13 ▼ 0.54% CVCB3 1.33 ▼ 2.92% POSI3 3.36 ▲ 2.44% SLCE3 13.34 ▲ 0.30% NATU3 8.14 ▼ 0.73% IBOV 185,500.88 ▼ 0.91% IPSA 11,342.39 ▲ 1.09% IPC MEX 64,216.98 ▲ 0.46% MERVAL 3,084,547 ▼ 0.46% COLCAP 2,588.25 ▼ 0.06% BVL PERÚ 59,184.75 ▼ 0.92% USD/BRL 5.16 ▲ 0.01% USD/MXN 17.06 ▼ 0.24% USD/CLP 913.98 ▲ 0.04% USD/COP 3,140 ▲ 0.03% USD/PEN 3.36 ▼ 0.66% USD/ARS 1,493 ▲ 0.10% USD/UYU 40.27 ▲ 1.24% USD/PYG 5,939 ▲ 1.68% USD/BOB 11.64 ▼ 0.76% USD/DOP 58.34 ▲ 1.25% USD/CRC 445.92 ▲ 0.89% USD/GTQ 7.62 ▲ 2.21% USD/HNL 26.79 ▲ 1.57% USD/NIO 36.62 ▲ 0.69% USD/VES 762.44 ▼ 0.13% USD/PAB 1.00 — 0.00% USD/BZD 2.00 — 0.00% USD/JMD 157.28 — 0.00% USD/TTD 6.70 ▲ 0.61% EUR/BRL 5.95 ▲ 1.01% BRENT 88.88 ▼ 0.03% WTI 83.11 ▼ 0.11% IRON ORE 161.91 — — COPPER 6.61 ▲ 0.03% GOLD 4,461 ▲ 1.78% SILVER 65.59 ▲ 1.26% SOY 1,184 ▲ 3.20% CORN 480.50 ▲ 10.02% WHEAT 655.00 ▲ 3.93% COFFEE 317.25 ▼ 5.51% SUGAR 16.43 ▼ 1.79% ORANGE JUICE 138.55 ▼ 0.47% COTTON 85.03 ▲ 2.33% COCOA 5,719 ▲ 3.18% BEEF 223.60 ▼ 3.93% CATTLE 339.10 ▼ 3.16% LITHIUM 75.20 ▲ 1.47% PETR4 41.64 ▼ 0.05% VALE3 72.97 ▲ 0.83% ITUB4 38.60 ▼ 1.03% BBDC4 16.85 ▲ 0.36% ABEV3 14.89 ▼ 0.80% BBAS3 19.37 ▲ 0.47% B3SA3 14.26 ▼ 0.21% WEGE3 47.59 ▲ 0.49% PRIO3 59.14 ▼ 0.19% SUZB3 41.33 ▲ 2.35% RENT3 34.68 ▼ 0.09% AZZA3 15.89 ▼ 2.63% CSAN3 3.22 ▼ 1.83% RAIZ4 0.25 — 0.00% PCAR3 2.75 ▼ 0.36% GMAT3 3.65 ▼ 1.08% PSSA3 48.13 ▼ 0.54% CVCB3 1.33 ▼ 2.92% POSI3 3.36 ▲ 2.44% SLCE3 13.34 ▲ 0.30% NATU3 8.14 ▼ 0.73%
since 2009
Tuesday, September 15, 2026

World-News Europe and Russia

Eurozone Industrial Output Recovers: Germany Leads January Growth

By · March 13, 2025 · 2 min read

The LatAm Brief

One email, every weekday morning. What moved in Latin American markets, politics and expat life.

Yesterday’s subject line: “Brazil's Supreme Court judges one of its own”

Free. We send a confirmation link first — nothing arrives until you click it. Unsubscribe with one click in any edition. If you stop opening us for 30 days we stop sending by ourselves, as we assume the interest is no longer there. See our privacy policy. We never share your email.

Eurozone industrial production climbed 0.8% in January 2025 compared to December, according to data released by Eurostat on March 13.

This growth surpassed market expectations of 0.6% and reversed the revised 0.4% decline recorded in December 2024. Germany powered the rebound with a strong 2.3% expansion, offsetting downturns in other major economies.

Spain reported a 1% production drop while Italy also experienced declining output. The production increase stemmed primarily from intermediate goods, which jumped 1.6% after December’s 1.7% decline.

Capital goods production grew modestly at 0.5%, contrasting with December’s 1.9% fall. However, several sectors continued to struggle. Non-durable consumer goods saw the steepest decline at 3.1%, while energy production fell 1.2% and durable consumer goods dipped 0.2%.

Year-on-year comparisons showed Eurozone industrial production remained stable in January, performing better than the European Union’s slight 0.2% decline. This stability marks an improvement over December’s annual drop of 1.5% and exceeded analysts’ predictions of a 0.9% contraction.
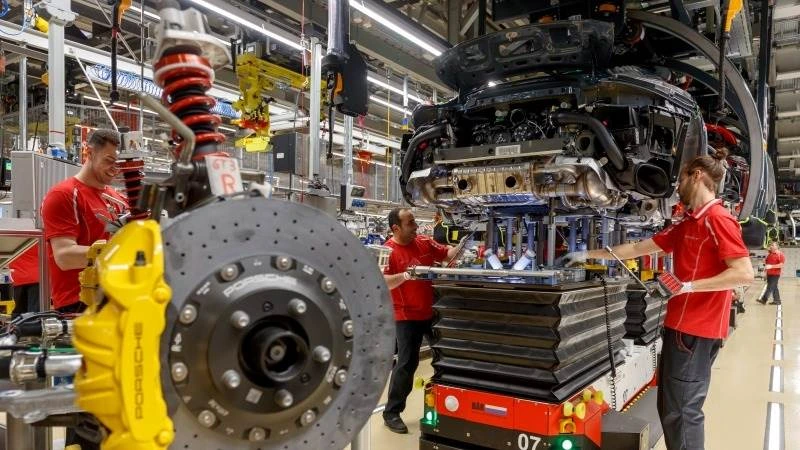
Eurozone Industrial Output Recovers: Germany Leads January Growth
Eurozone Industrial Output Recovers: Germany Leads January Growth.
One-stop reference
Company Intelligence
Every listed company in Latin America — financials, ownership and structure for 1,450+ companies across 26 exchanges, in one place.
Browse the directory →
RT
Ask Rio Times
17 years of Latin America reporting, on demand.
Open the full Ask Rio Times →

Across member states, Lithuania led with a robust 4.6% monthly growth, followed by Portugal at 3.7% and Austria at 3.3%. Malta experienced the sharpest decline at 12.9%, with Denmark and Slovakia following at 10.6% and 7.3% respectively.

European Energy & Industrial Sector Struggles

The energy sector faced ongoing challenges throughout Europe. Production decreased by 1.2% month-over-month and 1.6% year-over-year in the eurozone. EU-wide energy output fell 2% compared to December and 2.1% from last January.

German manufacturing shows signs of potential recovery after two difficult years marked by high energy costs and Chinese competition. However, analysts note that German manufacturing orders decreased 7% in January, suggesting continued vulnerability.

The European steel industry reflects broader uncertainty about sustained growth. EUROFER recently lowered its 2025 forecast for EU steel consumption growth to 2.2% from 3.8%. This adjustment acknowledges persistent challenges including high energy costs, global economic instability, and increasing import competition.

Despite January’s positive data, Eurozone industrial production remains approximately 3% below 2021 levels, highlighting the long road ahead for complete industrial recovery.

This article was produced by The Rio Times’ automated newsroom system. How we use AI · Report an error

Read More from The Rio Times

The Rio Times · Power Map
See who really holds power in Latin America
Click to open the Power Map

Rotate for Best Experience

This report is optimized for landscape viewing. Rotate your phone for the full experience.