IBOV 173,325.65 ▼ 0.03% IPSA 10,954.04 ▲ 0.52% IPC MEX 66,709.60 ▲ 0.88% MERVAL 3,281,979 — 0.00% COLCAP 2,301.34 ▲ 0.13% BVL PERÚ 56,620.35 — — USD/BRL5.08▲ 0.12% USD/MXN17.41▼ 0.04% USD/CLP936.98▲ 0.14% USD/COP3,220▼ 1.12% USD/PEN3.40▲ 0.02% USD/ARS1,478▼ 0.02% USD/UYU40.11▲ 1.23% USD/PYG6,045▲ 1.76% USD/BOB10.80▲ 2.69% USD/DOP58.02▼ 0.31% USD/CRC446.12▲ 1.15% USD/GTQ7.62▲ 2.33% USD/HNL26.74▲ 1.61% USD/NIO36.62▲ 0.72% USD/VES735.39▼ 0.13% USD/PAB1.00— 0.00% USD/BZD2.00— 0.00% USD/JMD157.79▲ 0.55% USD/TTD6.73▲ 1.11% EUR/BRL5.79▼ 0.45% BRENT 93.90 ▲ 3.18% WTI 86.73 ▲ 2.14% IRON ORE 161.91 — — COPPER 6.52 ▲ 0.08% GOLD 4,132 ▲ 1.49% SILVER 59.69 ▲ 1.45% SOY 1,231 ▲ 0.90% CORN 482.00 ▲ 6.46% WHEAT 696.50 ▲ 2.73% COFFEE 321.95 ▼ 3.01% SUGAR 14.79 ▼ 0.60% ORANGE JUICE 141.50 ▼ 1.60% COTTON 80.43 ▲ 1.86% COCOA 5,444 ▼ 2.91% BEEF 223.05 ▼ 1.53% CATTLE 344.88 ▼ 2.02% LITHIUM 69.08 ▲ 3.23% PETR4 41.66 ▲ 1.24% VALE3 72.37 ▲ 0.61% ITUB4 42.53 ▲ 0.54% BBDC4 18.55 ▲ 0.76% ABEV3 15.80 ▲ 0.06% BBAS3 20.88 ▲ 3.52% B3SA3 15.17 ▼ 0.59% WEGE3 42.47 ▼ 1.53% PRIO3 58.18 ▲ 0.85% SUZB3 41.63 ▼ 0.62% RENT3 36.55 ▼ 2.51% AZZA3 17.48 ▼ 3.80% CSAN3 3.78 ▼ 1.05% RAIZ4 0.27 — 0.00% PCAR3 2.73 ▲ 5.00% GMAT3 3.83 ▼ 0.52% PSSA3 53.48 ▼ 1.33% CVCB3 1.12 ▲ 3.70% POSI3 3.68 ▼ 0.54% SLCE3 13.75 ▲ 1.33% NATU3 8.71 ▲ 0.93% BRKM5 5.71 ▼ 3.87% RANI3 7.89 ▼ 1.25% CSNA3 5.06 ▼ 0.20% CMIN3 5.58 ▲ 3.53% USIM5 8.46 ▲ 3.68% GGBR4 23.49 ▼ 0.55% ENEV3 25.42 ▼ 0.90% CPFE3 46.40 ▲ 0.17% CMIG4 11.02 — 0.00% EQTL3 38.83 ▼ 1.17% LREN3 13.27 ▼ 0.30% VIVT3 35.80 ▲ 0.36% RAIL3 13.24 ▼ 2.43% KLABIN 17.59 ▲ 0.63% RAIA DROGASIL 18.13 ▼ 3.00% RDOR3 33.92 ▼ 4.32% HAPV3 11.24 ▼ 2.68% FLRY3 16.55 ▼ 0.06% SMTO3 15.58 ▲ 1.10% UGPA3 31.82 ▲ 0.38% VBBR3 33.95 ▼ 0.47% BBSE3 41.55 ▲ 1.22% BPAC11 55.37 ▼ 0.84% CURY3 29.95 ▼ 0.80% AERI3 2.04 ▼ 1.45% VIVARA 21.41 ▼ 2.50% COMPASS 24.44 ▼ 0.65% VAMOS 3.09 — 0.00% SANB11 27.21 ▲ 0.74% ASAI3 8.25 ▲ 1.35% SBSP3 28.60 ▼ 1.31% WALMEX 49.15 ▼ 0.47% GMEXICO 209.54 ▲ 4.34% FEMSA 226.99 ▲ 0.01% CEMEX 22.07 ▲ 0.87% GFNORTE 185.80 ▲ 3.22% BIMBO 59.39 ▼ 0.18% TELEVISA 9.70 ▼ 0.10% AMX 22.76 ▲ 0.09% GAP 378.85 ▲ 0.17% ASUR 274.96 ▲ 0.22% OMA 225.89 ▼ 0.24% KOF 181.05 ▲ 0.13% GRUMA 282.60 ▼ 1.74% KIMBER 38.40 ▲ 0.03% SQM-B 64,540 ▲ 2.25% COPEC 6,450 ▲ 4.03% BSANTANDER 79.01 ▲ 3.84% FALABELLA 5,919 ▲ 0.75% ENELAM 84.53 ▲ 0.50% CENCOSUD 2,028 ▲ 1.66% CMPC 1,084 ▲ 1.67% BANCO CHILE 190.01 ▲ 1.89% LATAM AIR 24.20 ▼ 0.86% YPF 80,625 ▲ 1.80% GGAL 7,965 ▲ 1.53% PAMPA 5,475 ▲ 3.89% TXAR 679.00 ▲ 1.27% ALUAR 973.00 ▲ 1.41% TGS 9,710 ▲ 2.21% CEPU 2,340 ▲ 2.23% MIRGOR 16,775 ▼ 2.04% COME 42.87 ▼ 0.19% LOMA NEGRA 3,605 ▲ 0.91% BYMA 292.25 ▼ 0.51% TELECOM ARG 4,255 ▲ 2.65% ECOPETROL 16.53 ▲ 3.09% BANCOLOMBIA 83.64 ▲ 3.49% GRUPO AVAL 5.09 ▲ 2.83% CREDICORP 391.10 ▲ 1.10% SOUTHERN COPPER 188.01 ▲ 7.39% BUENAVENTURA 31.25 ▲ 3.96% MERCADOLIBRE 1,823 ▼ 0.53% NUBANK 14.39 ▲ 2.86% XP 16.85 ▲ 0.30% PAGSEGURO 9.58 ▲ 3.12% STONE 11.26 ▲ 1.21% GLOBANT 32.10 ▼ 0.59% TECNOGLASS 45.15 ▼ 2.08% GAP AIRPORT 217.68 ▲ 0.26% ASUR 274.96 ▲ 0.22% OMA AIRPORT 104.23 ▲ 0.21% AMX ADR 26.09 ▼ 0.04% FEMSA ADR 130.35 ▲ 0.26% CEMEX ADR 12.70 ▲ 1.68% PETROBRAS ADR 18.54 ▲ 1.92% VALE ADR 14.25 ▲ 1.06% ITAU ADR 8.40 ▲ 0.96% SANTANDER BR 5.40 ▲ 0.56% AMBEV ADR 3.11 ▲ 0.97% CSN 1.01 ▼ 0.50% GERDAU 4.64 ▼ 0.85% LATAM ADR 51.58 ▼ 0.31% BTC 65,737 ▼ 1.16% ETH 1,920 ▼ 0.44% SOL 77.16 ▼ 1.21% XRP 1.13 ▼ 0.67% BNB 570.30 ▼ 0.57% ADA 0.17 ▼ 0.49% DOGE 0.07 ▼ 1.20% AVAX 6.51 ▼ 0.78% LINK 8.60 ▼ 0.59% DOT 0.84 ▼ 1.16% LTC 46.58 ▼ 0.50% BCH 221.46 ▼ 1.00% TRX 0.33 ▲ 0.02% XLM 0.19 ▼ 1.54% HBAR 0.07 ▲ 1.93% NEAR 1.88 ▼ 2.74% ATOM 1.47 ▼ 1.28% AAVE 96.69 ▲ 1.17% SELIC 14.25% EMBRAER 82.65 ▼ 0.77% EMBRAER ADR 65.47 ▼ 0.70% JBS 11.95 ▼ 0.67% JBS BDR 60.22 ▼ 0.94% MBRF3 15.11 ▲ 4.06% MBRFY 2.95 ▲ 1.37% INTER 5.58 ▼ 0.71% EGX 53,932 ▼ 0.11% USD/ZAR16.46▼ 0.09% USD/NGN 1,376 — 0.00% NIKKEI 66,116 ▼ 0.18% CSI300 4,717 ▼ 0.46% HSI 24,893 ▼ 0.95% NIFTY 23,996 ▼ 0.79% KOSPI 6,798 ▲ 0.74% JCI 6,334 ▼ 0.09% USD/JPY163.05▼ 0.07% USD/CNY6.76▼ 0.08% DAX 25,095 ▲ 0.34% CAC 8,447 ▲ 1.00% FTSE 10,737 ▲ 1.42% MIB 52,772 ▲ 0.93% IBEX 19,588 ▲ 1.07% STOXX 646.75 ▲ 0.55% EUR/USD1.14▲ 0.13% GBP/USD1.34▼ 0.49% SPX 7,509 ▲ 0.89% DJI 52,225 ▲ 0.74% NDX 29,155 ▲ 1.93% RUT 2,987 ▲ 1.53% TSX 35,369 ▲ 1.17% VIX 17.61 ▲ 3.28% USD/CAD1.41▼ 0.17% US10Y 4.6280 — 0.00% IBOV 173,325.65 ▼ 0.03% IPSA 10,954.04 ▲ 0.52% IPC MEX 66,709.60 ▲ 0.88% MERVAL 3,281,979 — 0.00% COLCAP 2,301.34 ▲ 0.13% BVL PERÚ 56,620.35 — — USD/BRL 5.08 ▲ 0.12% USD/MXN 17.41 ▼ 0.04% USD/CLP 936.98 ▲ 0.14% USD/COP 3,220 ▼ 1.12% USD/PEN 3.40 ▲ 0.02% USD/ARS 1,478 ▼ 0.02% USD/UYU 40.11 ▲ 1.23% USD/PYG 6,045 ▲ 1.76% USD/BOB 10.80 ▲ 2.69% USD/DOP 58.02 ▼ 0.31% USD/CRC 446.12 ▲ 1.15% USD/GTQ 7.62 ▲ 2.33% USD/HNL 26.74 ▲ 1.61% USD/NIO 36.62 ▲ 0.72% USD/VES 735.39 ▼ 0.13% USD/PAB 1.00 — 0.00% USD/BZD 2.00 — 0.00% USD/JMD 157.79 ▲ 0.55% USD/TTD 6.73 ▲ 1.02% EUR/BRL 5.79 ▼ 0.45% BRENT 93.90 ▲ 3.18% WTI 86.73 ▲ 2.14% IRON ORE 161.91 — — COPPER 6.52 ▲ 0.08% GOLD 4,132 ▲ 1.49% SILVER 59.69 ▲ 1.45% SOY 1,231 ▲ 0.90% CORN 482.00 ▲ 6.46% WHEAT 696.50 ▲ 2.73% COFFEE 321.95 ▼ 3.01% SUGAR 14.79 ▼ 0.60% ORANGE JUICE 141.50 ▼ 1.60% COTTON 80.43 ▲ 1.86% COCOA 5,444 ▼ 2.91% BEEF 223.05 ▼ 1.53% CATTLE 344.88 ▼ 2.02% LITHIUM 69.08 ▲ 3.23% PETR4 41.66 ▲ 1.24% VALE3 72.37 ▲ 0.61% ITUB4 42.53 ▲ 0.54% BBDC4 18.55 ▲ 0.76% ABEV3 15.80 ▲ 0.06% BBAS3 20.88 ▲ 3.52% B3SA3 15.17 ▼ 0.59% WEGE3 42.47 ▼ 1.53% PRIO3 58.18 ▲ 0.85% SUZB3 41.63 ▼ 0.62% RENT3 36.55 ▼ 2.51% AZZA3 17.48 ▼ 3.80% CSAN3 3.78 ▼ 1.05% RAIZ4 0.27 — 0.00% PCAR3 2.73 ▲ 5.00% GMAT3 3.83 ▼ 0.52% PSSA3 53.48 ▼ 1.33% CVCB3 1.12 ▲ 3.70% POSI3 3.68 ▼ 0.54% SLCE3 13.75 ▲ 1.33% NATU3 8.71 ▲ 0.93% BRKM5 5.71 ▼ 3.87% RANI3 7.89 ▼ 1.25% CSNA3 5.06 ▼ 0.20% CMIN3 5.58 ▲ 3.53% USIM5 8.46 ▲ 3.68% GGBR4 23.49 ▼ 0.55% ENEV3 25.42 ▼ 0.90% CPFE3 46.40 ▲ 0.17% CMIG4 11.02 — 0.00% EQTL3 38.83 ▼ 1.17% LREN3 13.27 ▼ 0.30% VIVT3 35.80 ▲ 0.36% RAIL3 13.24 ▼ 2.43% KLABIN 17.59 ▲ 0.63% RAIA DROGASIL 18.13 ▼ 3.00% RDOR3 33.92 ▼ 4.32% HAPV3 11.24 ▼ 2.68% FLRY3 16.55 ▼ 0.06% SMTO3 15.58 ▲ 1.10% UGPA3 31.82 ▲ 0.38% VBBR3 33.95 ▼ 0.47% BBSE3 41.55 ▲ 1.22% BPAC11 55.37 ▼ 0.84% CURY3 29.95 ▼ 0.80% AERI3 2.04 ▼ 1.45% VIVARA 21.41 ▼ 2.50% COMPASS 24.44 ▼ 0.65% VAMOS 3.09 — 0.00% SANB11 27.21 ▲ 0.74% ASAI3 8.25 ▲ 1.35% SBSP3 28.60 ▼ 1.31% WALMEX 49.15 ▼ 0.47% GMEXICO 209.54 ▲ 4.34% FEMSA 226.99 ▲ 0.01% CEMEX 22.07 ▲ 0.87% GFNORTE 185.80 ▲ 3.22% BIMBO 59.39 ▼ 0.18% TELEVISA 9.70 ▼ 0.10% AMX 22.76 ▲ 0.09% GAP 378.85 ▲ 0.17% ASUR 274.96 ▲ 0.22% OMA 225.89 ▼ 0.24% KOF 181.05 ▲ 0.13% GRUMA 282.60 ▼ 1.74% KIMBER 38.40 ▲ 0.03% SQM-B 64,540 ▲ 2.25% COPEC 6,450 ▲ 4.03% BSANTANDER 79.01 ▲ 3.84% FALABELLA 5,919 ▲ 0.75% ENELAM 84.53 ▲ 0.50% CENCOSUD 2,028 ▲ 1.66% CMPC 1,084 ▲ 1.67% BANCO CHILE 190.01 ▲ 1.89% LATAM AIR 24.20 ▼ 0.86% YPF 80,625 ▲ 1.80% GGAL 7,965 ▲ 1.53% PAMPA 5,475 ▲ 3.89% TXAR 679.00 ▲ 1.27% ALUAR 973.00 ▲ 1.41% TGS 9,710 ▲ 2.21% CEPU 2,340 ▲ 2.23% MIRGOR 16,775 ▼ 2.04% COME 42.87 ▼ 0.19% LOMA NEGRA 3,605 ▲ 0.91% BYMA 292.25 ▼ 0.51% TELECOM ARG 4,255 ▲ 2.65% ECOPETROL 16.53 ▲ 3.09% BANCOLOMBIA 83.64 ▲ 3.49% GRUPO AVAL 5.09 ▲ 2.83% CREDICORP 391.10 ▲ 1.10% SOUTHERN COPPER 188.01 ▲ 7.39% BUENAVENTURA 31.25 ▲ 3.96% MERCADOLIBRE 1,823 ▼ 0.53% NUBANK 14.39 ▲ 2.86% XP 16.85 ▲ 0.30% PAGSEGURO 9.58 ▲ 3.12% STONE 11.26 ▲ 1.21% GLOBANT 32.10 ▼ 0.59% TECNOGLASS 45.15 ▼ 2.08% GAP AIRPORT 217.68 ▲ 0.26% ASUR 274.96 ▲ 0.22% OMA AIRPORT 104.23 ▲ 0.21% AMX ADR 26.09 ▼ 0.04% FEMSA ADR 130.35 ▲ 0.26% CEMEX ADR 12.70 ▲ 1.68% PETROBRAS ADR 18.54 ▲ 1.92% VALE ADR 14.25 ▲ 1.06% ITAU ADR 8.40 ▲ 0.96% SANTANDER BR 5.40 ▲ 0.56% AMBEV ADR 3.11 ▲ 0.97% CSN 1.01 ▼ 0.50% GERDAU 4.64 ▼ 0.85% LATAM ADR 51.58 ▼ 0.31% BTC 65,737 ▼ 1.16% ETH 1,920 ▼ 0.44% SOL 77.16 ▼ 1.21% XRP 1.13 ▼ 0.67% BNB 570.30 ▼ 0.57% ADA 0.17 ▼ 0.49% DOGE 0.07 ▼ 1.20% AVAX 6.51 ▼ 0.78% LINK 8.60 ▼ 0.59% DOT 0.84 ▼ 1.16% LTC 46.58 ▼ 0.50% BCH 221.46 ▼ 1.00% TRX 0.33 ▲ 0.02% XLM 0.19 ▼ 1.54% HBAR 0.07 ▲ 1.93% NEAR 1.88 ▼ 2.74% ATOM 1.47 ▼ 1.28% AAVE 96.69 ▲ 1.17% SELIC 14.25% EMBRAER 82.65 ▼ 0.77% EMBRAER ADR 65.47 ▼ 0.70% JBS 11.95 ▼ 0.67% JBS BDR 60.22 ▼ 0.94% MBRF3 15.11 ▲ 4.06% MBRFY 2.95 ▲ 1.37% INTER 5.58 ▼ 0.71% EGX 53,932 ▼ 0.11% USD/ZAR 16.47 ▲ 0.05% USD/NGN 1,376 — 0.00% NIKKEI 66,116 ▼ 0.18% CSI300 4,717 ▼ 0.46% HSI 24,893 ▼ 0.95% NIFTY 23,996 ▼ 0.79% KOSPI 6,798 ▲ 0.74% JCI 6,334 ▼ 0.09% USD/JPY 163.07 ▼ 0.05% USD/CNY 6.7609 ▲ 0.06% DAX 25,095 ▲ 0.34% CAC 8,447 ▲ 1.00% FTSE 10,737 ▲ 1.42% MIB 52,772 ▲ 0.93% IBEX 19,588 ▲ 1.07% STOXX 646.75 ▲ 0.55% EUR/USD 1.1413 ▲ 0.08% GBP/USD 1.3369 ▼ 0.07% SPX 7,509 ▲ 0.89% DJI 52,225 ▲ 0.74% NDX 29,155 ▲ 1.93% RUT 2,987 ▲ 1.53% TSX 35,369 ▲ 1.17% VIX 17.61 ▲ 3.28% USD/CAD 1.4085 ▼ 0.15% US10Y 4.6280 — 0.00%
since 2009
Wednesday, July 22, 2026

Chart Patterns to Use for Trading During Bear Markets: A Strategic Guide

By · April 24, 2025 · 5 min read

Daily Brief

The morning intel from across Latin America. Free.

By subscribing you agree to our privacy policy. We never share your email.

(Sponsored) In the midst of the bear market, traders usually find themselves facing a challenging battle. Investor sentiment tends to be negative, the prices are declining, and market volatility is usually higher, leaving everyone wondering if there is a right time to trade.

But the market isn’t dead, so they can navigate these conditions – suppose they use the right tools. Chart patterns are visual cues that provide traders with understanding of market trends, reversals, and market sentiment.

As a trader, you must recognize and use these chart patterns to make informed decisions during bear markets. This article explores a series of chart patterns that have proven successful for trading in previous down markets, so you can gain insight and learn how to integrate them into your trading strategy.

Should you use chart patterns when trading during bear markets?

Sharp downtrends are the main feature of bear markets, but doesn’t mean there aren’t periods of consolidations or temporary rallies you can capitalize on.

If you use chart patterns you benefit from a structured way to identify these key moments and pinpoint when a potential continuation or reversal is on the horizon.

Regardless if you’re looking for potential bullish reversal or short-selling, after a prolonged downtrend, chart patterns are useful tools to have during bear markets.
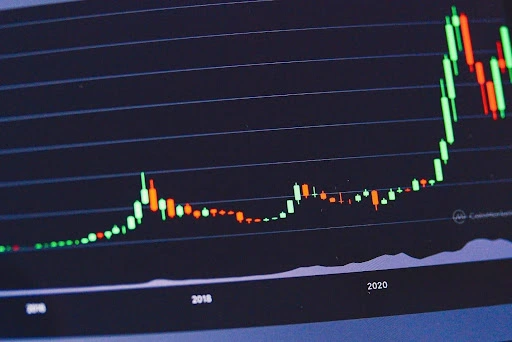
Chart Patterns to Use for Trading During Bear Markets: A Strategic Guide.
One-stop reference
Company Intelligence
Every listed company in Latin America — financials, ownership and structure for 1,450+ companies across 26 exchanges, in one place.
Browse the directory →
RT
Ask Rio Times
Latin American markets, currencies and companies.
Open the full Ask Rio Times →

When you craft a strategy proper for bear markets you can make more calculated moves and take advantage of the market’s temporary fluctuations, without having to wait for the market to enter the bullish days.

Chart patterns aren’t just useful tools for identifying the beginning and end of trends, they also provide information about momentum shifts and volatility, which are crucial in bear markets when assets’ prices suffer rapid price swings.

When you learn to recognize the patterns predicting movements in the market, you can avoid unnecessary losses and position yourself for gains, even when the market seems to be moving in the wrong direction.

A list of key patterns to use in bear markets

In the following list you will discover some of the most effective chart patterns to use during bear markets, but also some practical tips on how to use them when trading.

1. Head and Shoulders

The Head and Shoulders pattern is one of the most reliable reversal patterns, especially when it appears during a downtrend because it signals that the market is about to reverse direction, making it an essential tool in a bear market.

The pattern consists of three peaks: a higher peak (head) between two smaller peaks (shoulders). When the price breaks below the neckline, it confirms the pattern and signals a potential reversal to a bullish trend.

How to Trade:

  • Look for a confirmed neckline break below the shoulders.
  • Enter the trade once the price breaks through the neckline.
  • Set a price target based on the height of the pattern, which can be measured from the head to the neckline.
  • Use stop-loss orders to manage risk, especially in volatile market conditions. A stop-loss should be placed just above the right shoulder to protect against false breakouts.

2. Double Bottom

The Double Bottom pattern is a bullish reversal pattern that occurs after a prolonged downtrend and consists of two distinct low points (bottoms) with a moderate rally in between.

Once the price breaks above the resistance formed between the two bottoms, it signals that a reversal might be in play.

This pattern is especially useful in bear markets because it shows that selling pressure may be diminishing, and the market could be preparing for a rally.

How to Trade:

  • Watch for the price to break through the resistance level after forming the second bottom.
  • Enter a long position once the breakout is confirmed. This shows that the market has reversed its downtrend.
  • Set your stop-loss below the second bottom to manage risk. If the price falls below the bottom, it could mean that the pattern has failed.
  • The target price can be determined by measuring the distance from the bottoms to the resistance line, which will give you an estimated upward move.

3. Triple Bottom

Similar to the Double Bottom, the Triple Bottom pattern indicates a strong reversal signal, but it involves three distinct lows rather than just two.

The pattern shows that the downtrend is losing strength, and after the third low, the price is expected to break upward, signaling the potential for a bullish trend.

How to Trade:

  • Wait for the price to breach the resistance level formed after the third bottom.
    Enter a long position once the breakout is confirmed.
  • Triple Bottoms can be more reliable than Double Bottoms, but they may take longer to form. Therefore, patience is key.
  • Set a stop-loss below the lowest point of the third bottom to limit potential losses.

4. Falling Wedge

The Falling Wedge pattern is a continuation pattern often seen in bear markets which indicates that, despite the overall downtrend, the market is consolidating in a tighter range and might break upward.

The key to this pattern is the contracting price range, with the highs and lows narrowing over time. Although the market is still in a downtrend, the narrowing range suggests that buying pressure could be increasing and that a bullish breakout is on the horizon.

How to Trade:

  • Look for a breakout above the upper trendline of the wedge. This is when the pattern completes, and the price is expected to move higher.
  • Enter long after the breakout is confirmed. A strong breakout with increased volume indicates the start of an uptrend.
  • Consider setting a stop-loss below the lower trendline to protect against a false breakout.
  • Measure the height of the wedge to estimate the potential target for the price move.

5. Descending Triangle

The Descending Triangle is a bearish continuation pattern that typically forms during a downtrend. It is characterized by a horizontal support level and lower highs, which indicate that sellers are in control.

The pattern suggests that once the support level is broken, the downtrend will continue. In bear markets, the Descending Triangle often signals that the price is about to break down further, which can be an excellent opportunity for short-selling.

How to Trade:

  • Wait for a breakdown below the support level to enter a short position. The confirmation of the pattern occurs when the price moves below the horizontal support.
  • Set a price target based on the height of the triangle. Measure from the top of the triangle to the support level, and subtract that distance from the breakout point.
  • A stop-loss above the pattern’s upper trendline can protect your trade if the pattern fails.
  • Chart patterns are useful tools when you have to navigate a bear market because they provide you with valuable insight into potential market continuation trends or reversals.

Read More from The Rio Times

The Rio Times · Power Map
See who really holds power in Latin America
Click to open the Power Map

Rotate for Best Experience

This report is optimized for landscape viewing. Rotate your phone for the full experience.