IBOV 177,418.78 ▲ 1.00% IPSA 11,315.26 ▼ 1.14% IPC MEX 65,430.32 ▼ 0.08% MERVAL 3,033,848 ▲ 1.83% COLCAP 2,425.08 ▼ 1.33% BVL PERÚ 59,928.30 ▼ 0.80% USD/BRL5.19▲ 0.21% USD/MXN17.00▲ 0.05% USD/CLP933.85▲ 0.25% USD/COP3,212▲ 0.33% USD/PEN3.36▼ 0.12% USD/ARS1,509▼ 0.28% USD/UYU40.29▲ 0.05% USD/PYG5,892▼ 0.13% USD/BOB11.84▲ 0.51% USD/DOP58.64▲ 0.05% USD/CRC446.47▼ 0.04% USD/GTQ7.62▼ 0.02% USD/HNL26.84— 0.00% USD/NIO36.62▲ 0.14% USD/VES796.33▲ 0.29% USD/PAB1.00— 0.00% USD/BZD2.00— 0.00% USD/JMD 157.28 — 0.00% USD/TTD6.69▼ 0.37% EUR/BRL6.03▲ 0.27% BRENT 88.88 ▼ 0.03% WTI 83.11 ▼ 0.11% IRON ORE 161.91 — — COPPER 6.61 ▲ 0.03% GOLD 4,461 ▲ 1.78% SILVER 65.59 ▲ 1.26% SOY 1,184 ▲ 3.20% CORN 480.50 ▲ 10.02% WHEAT 655.00 ▲ 3.93% COFFEE 317.25 ▼ 5.51% SUGAR 16.43 ▼ 1.79% ORANGE JUICE 138.55 ▼ 0.47% COTTON 85.03 ▲ 2.33% COCOA 5,719 ▲ 3.18% BEEF 223.60 ▼ 3.93% CATTLE 339.10 ▼ 3.16% LITHIUM 75.20 ▲ 1.47% PETR4 41.64 ▼ 0.05% VALE3 72.97 ▲ 0.83% ITUB4 38.60 ▼ 1.03% BBDC4 16.85 ▲ 0.36% ABEV3 14.89 ▼ 0.80% BBAS3 19.37 ▲ 0.47% B3SA3 14.26 ▼ 0.21% WEGE3 47.59 ▲ 0.49% PRIO3 59.14 ▼ 0.19% SUZB3 41.33 ▲ 2.35% RENT3 34.68 ▼ 0.09% AZZA3 15.89 ▼ 2.63% CSAN3 3.22 ▼ 1.83% RAIZ4 0.25 — 0.00% PCAR3 2.75 ▼ 0.36% GMAT3 3.65 ▼ 1.08% PSSA3 48.13 ▼ 0.54% CVCB3 1.33 ▼ 2.92% POSI3 3.36 ▲ 2.44% SLCE3 13.34 ▲ 0.30% NATU3 8.14 ▼ 0.73% IBOV 177,418.78 ▲ 1.00% IPSA 11,315.26 ▼ 1.14% IPC MEX 65,430.32 ▼ 0.08% MERVAL 3,033,848 ▲ 1.83% COLCAP 2,425.08 ▼ 1.33% BVL PERÚ 59,928.30 ▼ 0.80% USD/BRL 5.16 ▲ 0.01% USD/MXN 17.06 ▼ 0.24% USD/CLP 913.98 ▲ 0.04% USD/COP 3,140 ▲ 0.03% USD/PEN 3.36 ▼ 0.66% USD/ARS 1,493 ▲ 0.10% USD/UYU 40.27 ▲ 1.24% USD/PYG 5,939 ▲ 1.68% USD/BOB 11.64 ▼ 0.76% USD/DOP 58.34 ▲ 1.25% USD/CRC 445.92 ▲ 0.89% USD/GTQ 7.62 ▲ 2.21% USD/HNL 26.79 ▲ 1.57% USD/NIO 36.62 ▲ 0.69% USD/VES 762.44 ▼ 0.13% USD/PAB 1.00 — 0.00% USD/BZD 2.00 — 0.00% USD/JMD 157.28 — 0.00% USD/TTD 6.70 ▲ 0.61% EUR/BRL 5.95 ▲ 1.01% BRENT 88.88 ▼ 0.03% WTI 83.11 ▼ 0.11% IRON ORE 161.91 — — COPPER 6.61 ▲ 0.03% GOLD 4,461 ▲ 1.78% SILVER 65.59 ▲ 1.26% SOY 1,184 ▲ 3.20% CORN 480.50 ▲ 10.02% WHEAT 655.00 ▲ 3.93% COFFEE 317.25 ▼ 5.51% SUGAR 16.43 ▼ 1.79% ORANGE JUICE 138.55 ▼ 0.47% COTTON 85.03 ▲ 2.33% COCOA 5,719 ▲ 3.18% BEEF 223.60 ▼ 3.93% CATTLE 339.10 ▼ 3.16% LITHIUM 75.20 ▲ 1.47% PETR4 41.64 ▼ 0.05% VALE3 72.97 ▲ 0.83% ITUB4 38.60 ▼ 1.03% BBDC4 16.85 ▲ 0.36% ABEV3 14.89 ▼ 0.80% BBAS3 19.37 ▲ 0.47% B3SA3 14.26 ▼ 0.21% WEGE3 47.59 ▲ 0.49% PRIO3 59.14 ▼ 0.19% SUZB3 41.33 ▲ 2.35% RENT3 34.68 ▼ 0.09% AZZA3 15.89 ▼ 2.63% CSAN3 3.22 ▼ 1.83% RAIZ4 0.25 — 0.00% PCAR3 2.75 ▼ 0.36% GMAT3 3.65 ▼ 1.08% PSSA3 48.13 ▼ 0.54% CVCB3 1.33 ▼ 2.92% POSI3 3.36 ▲ 2.44% SLCE3 13.34 ▲ 0.30% NATU3 8.14 ▼ 0.73%
since 2009
Tuesday, September 1, 2026

Petrobras Records net Profit of R$18.9 Billion in the Second Quarter

By · August 3, 2019 · 2 min read

Daily Brief

The morning intel from across Latin America. Free.

By subscribing you agree to our privacy policy. We never share your email.

RIO DE JANEIRO, BRAZIL – Petrobras reported that it recorded net profits of R$18.9 billion (US$4.73 billion) in the second quarter of this year, a historical record. A note published by the state-owned company states that the result represents an increase of 368 percent over the net profits for the first quarter of the year (R$4 billion) and 87 percent over the second quarter of 2018 (R$10.1 billion).
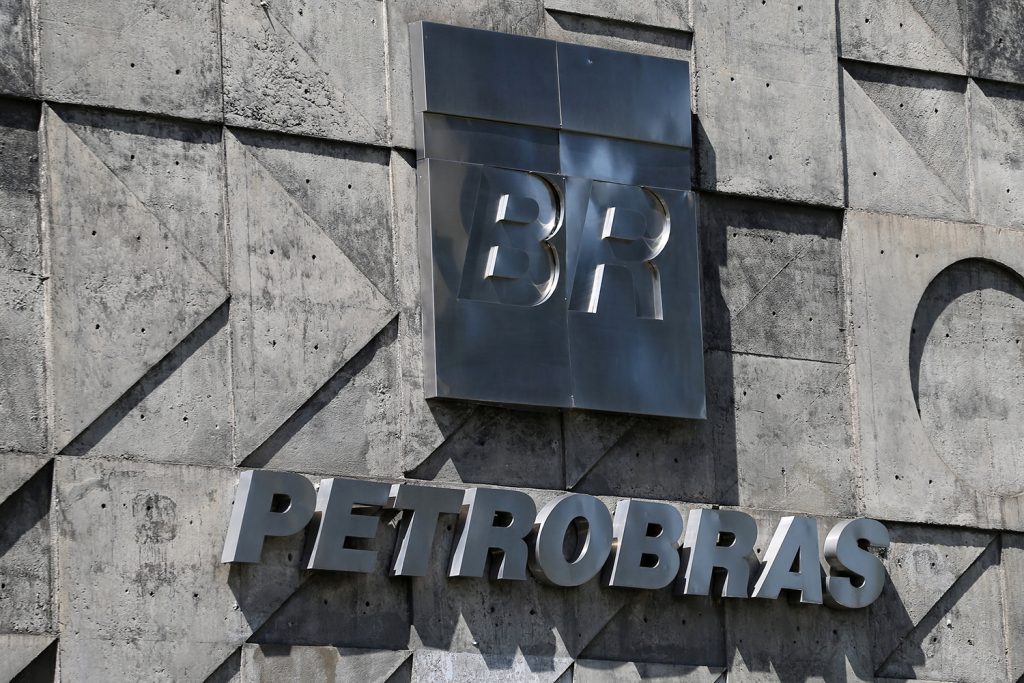
The main reason for the profit was the completion of the sale of 90 percent of Petrobras' stake in Transportadora Associada de Gás S.A. (TAG).
The main reason for the profit was the completion of the sale of ninety percent of Petrobras’ stake in Transportadora Associada de Gás S.A. (TAG). (Photo internet reproduction)
RT
Ask Rio Times
Latin American markets, currencies and companies.
Open the full Ask Rio Times →

The main reason for the profit was the completion of the sale of ninety percent of Petrobras’ stake in Transportadora Associada de Gás S.A. (TAG), for R$33.5 billion, of which R$2 billion were used to settle the carrier’s debt with the BNDES.

The increase in the international oil price and the appreciation of the dollar against the real have also contributed to this result.

The adjusted EBITDA — Earnings Before Interest, Taxes, Depreciation, and Amortization — stood at R$32.7 billion in the quarter, an increase of nineteen percent over the first quarter. This result was influenced by higher oil prices, higher diesel sales volumes, and increased margins for gasoline, naphtha, and natural gas.

Net Debt

Free cash flow was positive for the 17th consecutive quarter, totaling R$11.3 billion. The net debt, on the other hand, continued its downward trend at US$83.7 billion in the second quarter of this year, a reduction of twelve percent over the previous quarter.

Investments totaled US$2.6 billion, of which 82 percent in exploration and production activities. “We achieved a good financial result in the second quarter, benefiting mainly from the sale of TAG, with net profits reaching a historical record of R$19 billion. We will pursue our path to generate value, focusing on assets with a higher return, such as pre-salt, and relentless search for cost reduction,” said the president of Petrobras, Roberto Castello Branco, in a note.

According to Petrobras, the company’s oil and natural gas production totaled 2.63 million barrels of oil equivalent per day in the second quarter, an increase of 3.8 percent over the first quarter of this year. In the pre-salt fields alone, production grew 12.7 percent, with 1.17 million barrels of oil per day.

Live Company IntelligencePetroleo Brasileiro Petrobras SA ADR — the full investor dossierInside: live share price, market cap, three-year financials, valuation, ESG and peer benchmarks — plus the latest Rio Times coverage.
P
◆ Live Company Intelligence
Petroleo Brasileiro Petrobras
NYSE: PBRPETR4EnergyOil & Gas Integrated43,199 employees
$119.41B
Market cap
Analyst target $22.03

Wall Street view

4.4Buy/ 5
11 Buy3 Hold0 Sell
Avg. price target $22.03  ·  +30% vs 200-day

Valuation & profitability

Market cap$119.41B
Revenue (TTM)$548.49B
P / E ratio4.6
Profit margin24.3%
Return on equity30.3%

Price & risk

52-wk low
$10.65
52-wk high
$21.44
Beta (volatility)-0.22
200-day average$16.90

Revenue trend · 6y

20202025
Latest $88.10B

Ownership

Institutions22.3%
Shares outstanding3.72B
Top holderGQG Partners LLC
Institutional holders5+ funds

Dividend

Yield20.1%
Payout ratio28.3%
Fwd. annual$1.68
What Petroleo Brasileiro Petrobras does. Petróleo Brasileiro S.A. – Petrobras explores, produces, and sells oil and gas in Brazil, China, the United States, the Americas, Asia, Europe, Singapore, and internationally. It operates through three segments: Exploration and Production; Refining, Transportation & Marketing; and Gas & Low Carbon Energies. The Exploration and Production segment explores, develops, and produces…
Data: RT fundamentals (PBR.US) · figures in USD · as of 1 Sep 2026More company intelligence →

This article was produced by The Rio Times’ automated newsroom system. How we use AI · Report an error

Read More from The Rio Times

The Rio Times · Power Map
See who really holds power in Latin America
Click to open the Power Map

Rotate for Best Experience

This report is optimized for landscape viewing. Rotate your phone for the full experience.