Benin Economy Grew 8.1% in 2025 on Port and Factory Work
BENIN · ECONOMY
Key Facts
- —The number The World Bank and the African Development Bank both put 2025 growth at 8.1%. The IMF puts the same year at 7.5%.
- —The source of it Services grew 8.7% and contributed 4.1 percentage points. Agriculture grew 6%.
- —The port Merchandise traffic at Cotonou rose sharply in the third quarter of 2025. The IMF records 35% year on year, the World Bank 69.9%.
- —The zone The Glô-Djigbé industrial zone covers 1,640 hectares across three phases, 45 kilometres from the port.
- —The debt The IMF revised public debt up to 60.5% of GDP at end-2024. The World Bank shows 56.8% for 2025, falling to 53.2% by 2028.
- —The programme The IMF arrangements ended in February 2026 after a final review. Cumulative disbursements were about US$664.7 million.
- —The closed border The Niger border has been shut since late 2023. Niger was Benin’s fourth largest West African export destination, at 12.8% of export value.
Benin is growing faster than almost anywhere in Africa. The engine is a port that recovered and an industrial zone that turns cotton into clothes.
Eight Per Cent, and Which Eight Per Cent
Benin grew 8.1% in 2025. That figure comes from the World Bank’s Macro Poverty Outlook published in April 2026. The African Development Bank gives the same number in its own 2026 outlook.
The IMF does not. Its staff report of February 2026 puts 2025 growth at 7.5%, following 6.3% in 2024. It projects 7.5% again for 2026 and 7.0% for 2027.
The gap is not large, but it matters for anyone quoting the figure. Anybody attributing 8.1% to the IMF is wrong. The number belongs to the World Bank and the African Development Bank.
The composition is consistent across sources. Services grew 8.7% and contributed 4.1 percentage points of the total. Agriculture grew 6%. Inflation was unusually low, at 1.1% in 2025, with 1.7% projected for 2026.
The World Bank projects 7.0% for 2026, 7.2% for 2027 and 7.3% for 2028. Poverty measured at the US$4.20 a day line is expected to fall from 40.1% in 2025 to 33.1% by 2028.
Cotonou: The Port That Funds the State
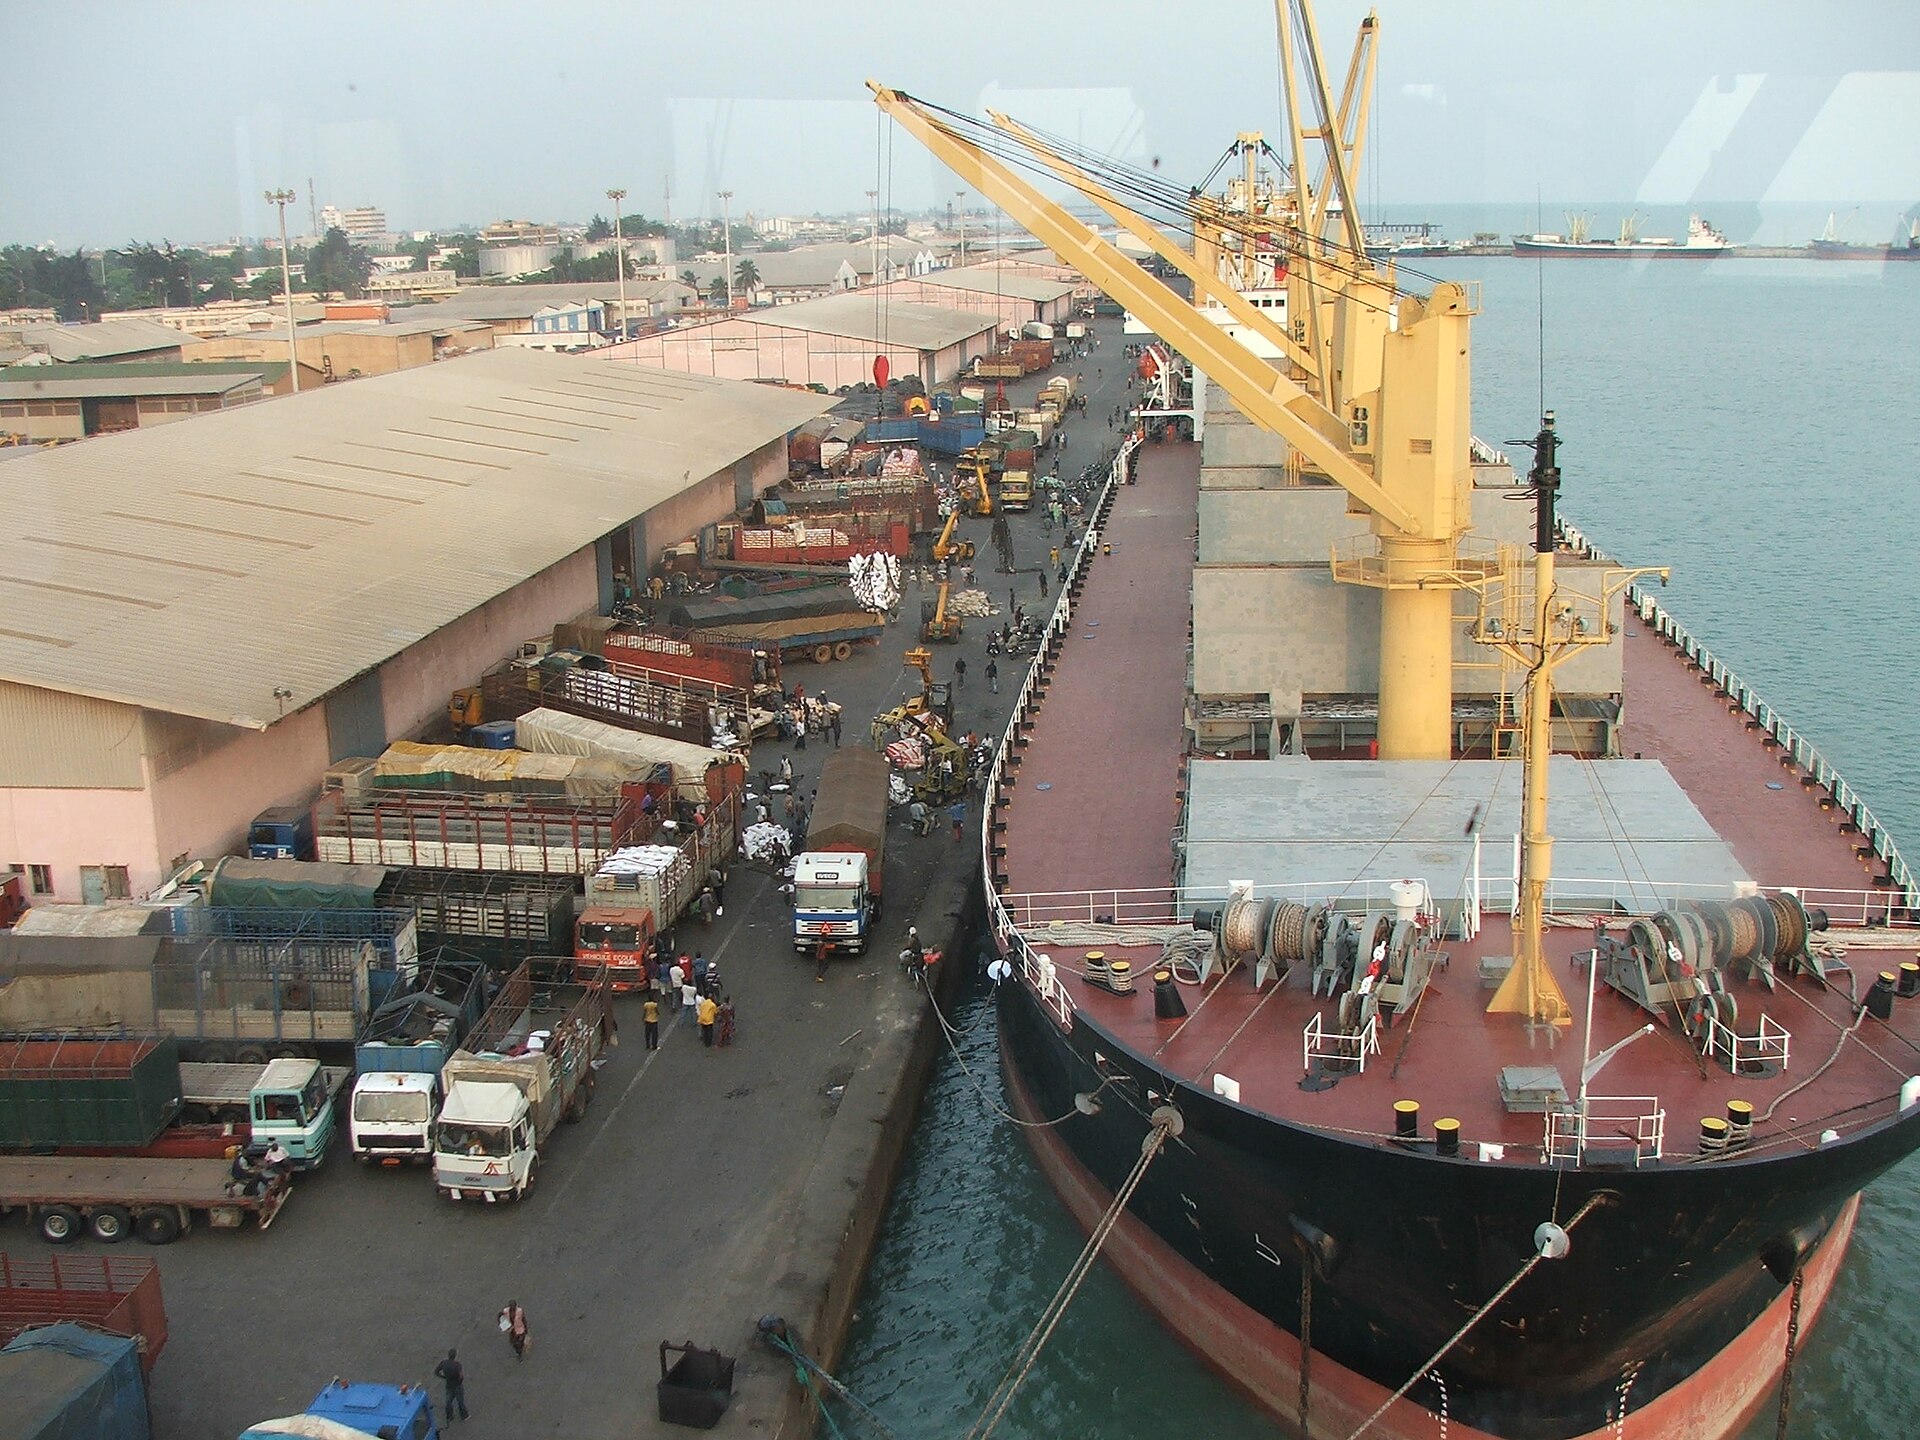
The Port of Cotonou is the economic centre of Benin, and its recovery is the clearest single driver in the 2025 numbers.
Both institutions record a sharp third-quarter rebound in 2025, though they measure it differently. The IMF reports merchandise traffic growing 35% year on year. The World Bank reports volumes up 69.9%. The Fund attributes the recovery to a low base after the closure of the Niger border.
Quarterly tonnage gives a sense of scale. Figures reported from the finance ministry’s budget execution report show 3,153,472 tonnes in the second quarter of 2025, against 2,095,245 a year earlier. Imports rose 34.7% and exports 109.8%. There were 210 vessel calls in the quarter. Before 2023 the port handled more than 12 million tonnes a year.
The port is being enlarged. The African Development Bank approved a €55 million loan in February 2025. A joint fund with the People’s Bank of China added €25 million, and a Canadian climate fund about US$18.3 million. The works cover a new 25-hectare terminal on reclaimed land, dredging, channel widening, a sea wall extension and a 14-hectare smart parking facility with automated gates.
Cotton Into Cloth
The Glô-Djigbé industrial zone, 45 kilometres from the port, is the government’s answer to a long-standing problem. Benin grew cotton and sold it raw.
The zone is a partnership between the Republic of Benin and an industrial park developer. It covers 1,640 hectares across three phases, with tax relief on income, customs duties and value added tax for tenants.
Figures on what it has achieved come from news agencies rather than from the government, and should be read that way. Reporting in August 2026 put mobilised investment above €1.3 billion, with 16,000 direct textile jobs and more than 25,000 in total across textiles, garments and agribusiness. The stated target is 300,000 direct jobs by 2030.
Capacity figures are more concrete. The zone is reported able to process 40,000 tonnes of fibre and produce 24 million garments a year. That is roughly an eighth of Benin’s annual fibre output.
Cotton production itself remains large. The regional cotton programme recorded 647,290 tonnes of seed cotton over 510,897 hectares for the 2025 and 2026 season. Cotton exports generated about 223.5 billion CFA francs in 2025, roughly US$398 million. The agriculture ministry has stated a target of 700,000 tonnes for the following season.
The Cashew Ban That Has Not Worked Yet
Benin banned raw cashew exports in April 2024. The aim was to force processing to happen at home rather than in Asia.
Two years on, the assessment from a tree nut market specialist is blunt. Production runs at 170,000 to 180,000 tonnes a year. Under 30% is processed domestically. Roughly 70% moves through informal channels to neighbouring countries.
That is the recurring difficulty with export bans on agricultural commodities. A border that is porous converts a ban into a smuggling route, and the value the state hoped to capture leaves anyway, untaxed.
The contrast with cotton is instructive. Cotton processing succeeded because the state built the industrial capacity first and then directed the crop into it. Cashew policy reversed the order.
Debt, the Fund, and What Comes Next
Benin’s IMF programme has ended. A blended arrangement worth about US$638 million was approved in July 2022, with a resilience facility added in December 2023. Both were extended to 28 February 2026, and the final reviews were completed on 25 February 2026.
Cumulative disbursements came to about US$664.7 million under the main arrangements and about US$204 million under the resilience facility. Benin is assessed at moderate risk of debt distress.
The debt figures differ by source and vintage. The IMF revised public debt upward to 60.5% of GDP at end-2024. The World Bank shows 56.8% for 2025, falling to 53.2% by 2028. The fiscal deficit was around 2.9% of GDP in 2025 and the current account deficit between 5.7% and 6.2%.
Whether a successor programme is under discussion has not been announced.
What This Means If You Invest or Trade Here
For investors, Benin is one of the few places in the region where an industrial policy has visibly produced factories. The combination of a working port, a tax-privileged zone and a domestic raw material is unusual, and the growth numbers reflect it.
Two cautions belong alongside that. The employment and investment figures for the industrial zone come from news agencies and the developer, not from the government or the investment promotion agency. And a zone built on tax exemptions raises revenue questions the state will eventually have to answer.
The closed Niger border is the largest unresolved variable. Niger accounted for 12.8% of Benin’s West African export value before the closure in late 2023. The customs post at Niamey Route once processed around 500 vehicles a week, peaking at 750 to 800 trucks. A committee on reopening has been established.
For traders, that reopening is the single event most likely to change volumes at Cotonou. The port is a transit corridor as much as a national gateway. A large share of its historic throughput was destined for a landlocked neighbour that currently cannot receive it.
For anyone living here, inflation at around 1% is very low by regional standards. The growth behind it is concentrated in services and in one industrial corridor, rather than spread evenly.
What the Currency Does and Does Not Do
Benin uses the CFA franc of West Africa, shared across eight countries and pegged to the euro. Monetary policy is set regionally, at the Central Bank of West African States.
That arrangement is a large part of why inflation came in near 1% in a year when much of the continent was still absorbing a fuel and fertiliser shock. A euro peg imports European price stability, and it makes imported inputs predictable for a manufacturer planning a year ahead.
The cost is the familiar one. Benin cannot devalue to make its garments cheaper, and it cannot loosen policy to support demand. Competitiveness has to come from productivity, logistics and energy costs instead.
For an industrial zone selling into export markets, that trade is probably favourable. Predictable input costs and a convertible currency matter more to a garment buyer than an exchange rate that might move in their favour.
It also means the regional securities market is where the state borrows. Financing conditions across the union therefore shape Benin’s fiscal room as much as its own budget choices do.
What Is Not Known
The industrial zone’s investment and employment figures have not been published by the government or the investment promotion agency. All available numbers come from news agencies or the developer.
Container throughput at Cotonou, measured in standard containers, is not published, nor is full year 2025 tonnage.
Whether a successor IMF programme will follow the February 2026 expiry has not been announced.
The legal instrument behind the cashew export ban was not identified in any source we reviewed.
And two cotton production figures for the 2025 and 2026 season circulate, 647,290 tonnes from the regional programme and a materially lower figure in news reporting. We have used the regional programme number.
Connected Coverage
- Taxes in Morocco for Expats 2026: The 37% Band Starts Early
- Kenya Residency Visa Requirements 2026: Class K Starts at 35
- Taxes in Ghana for Expats 2026: Residency Can Raise Your Rate
Sources
- World Bank — Benin Macro Poverty Outlook, April 2026
- IMF — Benin, seventh review under the extended arrangements, February 2026
- African Development Bank — Benin economic outlook
- African Development Bank — €80 million to modernise and extend the Port of Cotonou
Frequently Asked Questions
How fast did Benin’s economy grow in 2025?
The World Bank and the African Development Bank both put growth at 8.1%. The IMF puts the same year at 7.5%. Anyone attributing the 8.1% figure to the IMF is quoting it wrongly.
What is driving the growth?
Services grew 8.7% and contributed 4.1 percentage points, with agriculture up 6%. The recovery of traffic at the Port of Cotonou and the industrial zone outside the city are the visible engines.
What is the Glo-Djigbe industrial zone?
A 1,640-hectare industrial park 45 kilometres from the Port of Cotonou, developed as a partnership between the state and an industrial park developer, with tax relief for tenants. It processes cotton into garments.
Is the border with Niger still closed?
Yes, it has been shut since late 2023. Niger was Benin’s fourth largest West African export destination at 12.8% of export value. A committee on reopening modalities has been established.
This article was produced by The Rio Times’ automated newsroom system. How we use AI · Report an error
Read More from The Rio Times