IBOV 187,422.92 ▲ 0.44% IPSA 11,426.83 ▲ 0.61% IPC MEX 64,456.59 ▲ 1.45% MERVAL 2,997,659 ▼ 0.04% COLCAP 2,588.64 ▲ 0.90% BVL PERÚ 59,529.36 ▲ 1.84% USD/BRL5.11▲ 0.10% USD/MXN17.33▲ 0.21% USD/CLP943.65▼ 0.59% USD/COP3,204— 0.00% USD/PEN3.38▲ 0.09% USD/ARS1,514▼ 0.02% USD/UYU40.06▲ 2.88% USD/PYG5,918▲ 3.14% USD/BOB11.85▲ 25.24% USD/DOP59.28▲ 0.82% USD/CRC445.27▲ 2.84% USD/GTQ7.63▲ 3.24% USD/HNL26.86▲ 3.32% USD/NIO36.62▲ 2.68% USD/VES851.37— 0.00% USD/PAB1.00— 0.00% USD/BZD2.00— 0.00% USD/JMD 157.28 — 0.00% USD/TTD6.74▲ 2.48% EUR/BRL5.83▼ 0.38% BRENT 88.88 ▼ 0.03% WTI 83.11 ▼ 0.11% IRON ORE 161.91 — — COPPER 6.61 ▲ 0.03% GOLD 4,461 ▲ 1.78% SILVER 65.59 ▲ 1.26% SOY 1,184 ▲ 3.20% CORN 480.50 ▲ 10.02% WHEAT 655.00 ▲ 3.93% COFFEE 317.25 ▼ 5.51% SUGAR 16.43 ▼ 1.79% ORANGE JUICE 138.55 ▼ 0.47% COTTON 85.03 ▲ 2.33% COCOA 5,719 ▲ 3.18% BEEF 223.60 ▼ 3.93% CATTLE 339.10 ▼ 3.16% LITHIUM 75.20 ▲ 1.47% PETR4 41.64 ▼ 0.05% VALE3 72.97 ▲ 0.83% ITUB4 38.60 ▼ 1.03% BBDC4 16.85 ▲ 0.36% ABEV3 14.89 ▼ 0.80% BBAS3 19.37 ▲ 0.47% B3SA3 14.26 ▼ 0.21% WEGE3 47.59 ▲ 0.49% PRIO3 59.14 ▼ 0.19% SUZB3 41.33 ▲ 2.35% RENT3 34.68 ▼ 0.09% AZZA3 15.89 ▼ 2.63% CSAN3 3.22 ▼ 1.83% RAIZ4 0.25 — 0.00% PCAR3 2.75 ▼ 0.36% GMAT3 3.65 ▼ 1.08% PSSA3 48.13 ▼ 0.54% CVCB3 1.33 ▼ 2.92% POSI3 3.36 ▲ 2.44% SLCE3 13.34 ▲ 0.30% NATU3 8.14 ▼ 0.73% IBOV 187,422.92 ▲ 0.44% IPSA 11,426.83 ▲ 0.61% IPC MEX 64,456.59 ▲ 1.45% MERVAL 2,997,659 ▼ 0.04% COLCAP 2,588.64 ▲ 0.90% BVL PERÚ 59,529.36 ▲ 1.84% USD/BRL 5.16 ▲ 0.01% USD/MXN 17.06 ▼ 0.24% USD/CLP 913.98 ▲ 0.04% USD/COP 3,140 ▲ 0.03% USD/PEN 3.36 ▼ 0.66% USD/ARS 1,493 ▲ 0.10% USD/UYU 40.27 ▲ 1.24% USD/PYG 5,939 ▲ 1.68% USD/BOB 11.64 ▼ 0.76% USD/DOP 58.34 ▲ 1.25% USD/CRC 445.92 ▲ 0.89% USD/GTQ 7.62 ▲ 2.21% USD/HNL 26.79 ▲ 1.57% USD/NIO 36.62 ▲ 0.69% USD/VES 762.44 ▼ 0.13% USD/PAB 1.00 — 0.00% USD/BZD 2.00 — 0.00% USD/JMD 157.28 — 0.00% USD/TTD 6.70 ▲ 0.61% EUR/BRL 5.95 ▲ 1.01% BRENT 88.88 ▼ 0.03% WTI 83.11 ▼ 0.11% IRON ORE 161.91 — — COPPER 6.61 ▲ 0.03% GOLD 4,461 ▲ 1.78% SILVER 65.59 ▲ 1.26% SOY 1,184 ▲ 3.20% CORN 480.50 ▲ 10.02% WHEAT 655.00 ▲ 3.93% COFFEE 317.25 ▼ 5.51% SUGAR 16.43 ▼ 1.79% ORANGE JUICE 138.55 ▼ 0.47% COTTON 85.03 ▲ 2.33% COCOA 5,719 ▲ 3.18% BEEF 223.60 ▼ 3.93% CATTLE 339.10 ▼ 3.16% LITHIUM 75.20 ▲ 1.47% PETR4 41.64 ▼ 0.05% VALE3 72.97 ▲ 0.83% ITUB4 38.60 ▼ 1.03% BBDC4 16.85 ▲ 0.36% ABEV3 14.89 ▼ 0.80% BBAS3 19.37 ▲ 0.47% B3SA3 14.26 ▼ 0.21% WEGE3 47.59 ▲ 0.49% PRIO3 59.14 ▼ 0.19% SUZB3 41.33 ▲ 2.35% RENT3 34.68 ▼ 0.09% AZZA3 15.89 ▼ 2.63% CSAN3 3.22 ▼ 1.83% RAIZ4 0.25 — 0.00% PCAR3 2.75 ▼ 0.36% GMAT3 3.65 ▼ 1.08% PSSA3 48.13 ▼ 0.54% CVCB3 1.33 ▼ 2.92% POSI3 3.36 ▲ 2.44% SLCE3 13.34 ▲ 0.30% NATU3 8.14 ▼ 0.73%
since 2009
Wednesday, September 23, 2026

August Sees Colombia’s Unemployment Dip to 9.3%

By · September 29, 2023 · 2 min read

The LatAm Brief

One email, every weekday morning. What moved in Latin American markets, politics and expat life.

Yesterday’s subject line: “68 strikes, 223 people. A UN expert says murder.”

Free. We send a confirmation link first — nothing arrives until you click it. Unsubscribe with one click in any edition. If you stop opening us for 30 days we stop sending by ourselves, as we assume the interest is no longer there. See our privacy policy. We never share your email.

Colombia’s August unemployment rate dropped to 9.3%, reports the National Administrative Department of Statistics (DANE).

The rate was 10.6% a year ago, marking a 1.3-point decrease. Compared to July’s 9.6%, it’s a 0.3-point drop.

The overall workforce participation in August hit 64.4%. This shows a 1-point boost from 63.5% last August.

Additionally, 58.5% were employed, up by 1.7 points from the previous year.

The jobless rate in 13 cities and metro areas stood at 9.6%. This is 1.2 points less than last year’s 10.8%.

Workforce participation rose to 66.4% in these areas, gaining 1.3 points. Employment also went up to 60%, increasing by 2 points.

From June to August, Colombia’s jobless rate was 9.4%, down 1.6 points from last year.
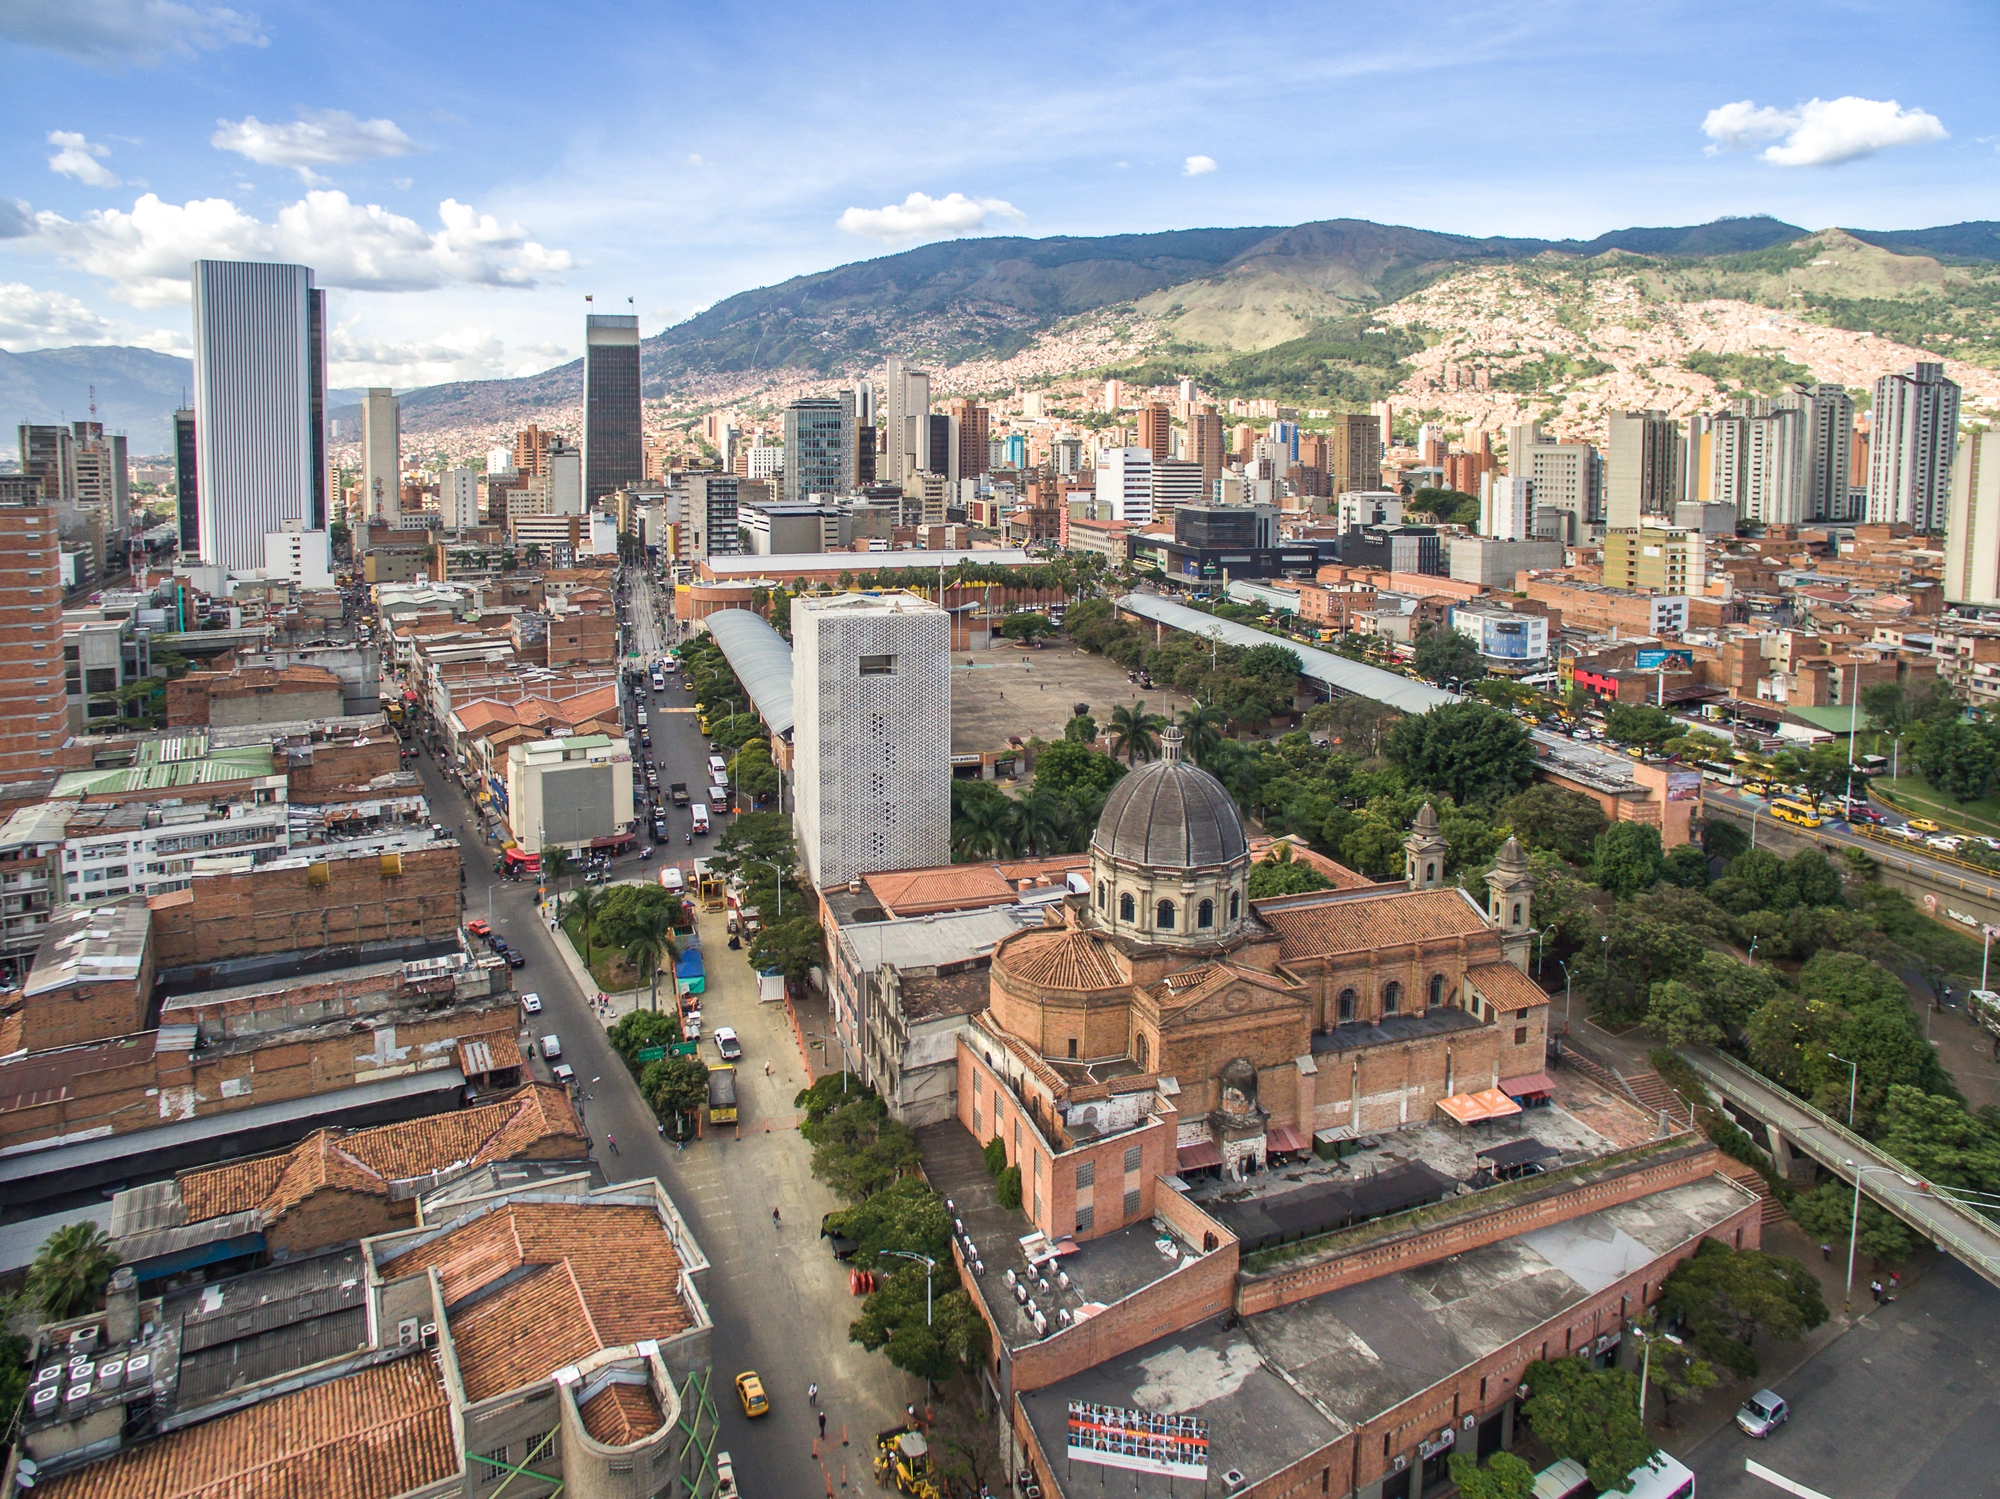
August Sees Colombia's Unemployment Dip to 9.3%.
August Sees Colombia’s Unemployment Dip to 9.3%.
One-stop reference
Company Intelligence
Every listed company in Latin America — financials, ownership and structure for 1,450+ companies across 26 exchanges, in one place.
Browse the directory →
RT
Ask Rio Times
17 years of Latin America reporting, on demand.
Open the full Ask Rio Times →

Workforce participation during this period was 64.5%, rising 1 point. Moreover, 58.5% were employed, climbing 1.9 points.

In August, 23.16 million people had jobs nationally. Leading sectors included manufacturing, public services, and agriculture.

Each sector contributed 0.8 to 0.9 points to employment growth.

Private employees and freelancers mainly drove this positive change. They added 2.2 and 0.9 points, respectively to national employment numbers.

Lastly, cities like Quibdó, Ibagué, and Florencia had the highest jobless rates. On the flip side, Santa Marta, Medellín, and Bucaramanga had the lowest.

This decline in unemployment is a positive sign for Colombia’s economy. The data shows a consistent drop, which can boost consumer spending.

It can also lead to increased investment and development. However, disparities exist, especially among different cities.

Addressing these local issues can contribute to a more balanced economic growth. The trend seems promising, but targeted strategies can improve it.

Background Colombia Unemployment

This data is key for policymakers, as a lower unemployment rate often signals economic vitality.

Yet, it’s crucial to note that not all sectors or cities benefit equally. For example, Quibdó’s high unemployment rate is a concern.

Addressing localized joblessness could make the national rate dip even more.

Additionally, an increased workforce participation rate is promising. It suggests that more people are optimistic about finding work.

This could influence the labor market positively, as higher job demand might lead to higher wages.

A detailed view of the employment landscape can help refine economic plans, making them more effective and inclusive.

This article was produced by The Rio Times’ automated newsroom system. How we use AI · Report an error

Read More from The Rio Times

The Rio Times · Power Map
See who really holds power in Latin America
Click to open the Power Map

Rotate for Best Experience

This report is optimized for landscape viewing. Rotate your phone for the full experience.