Angola’s Economy Grew 8.74% in Q2, With Diamonds Out Front
ANGOLA · ECONOMY
Key Facts
The headline: Angola’s economy grew 8.74% year on year in the second quarter of 2026, the National Statistics Institute reported on Friday.
Non-oil in front: The non-oil economy expanded 9.24%, ahead of the oil sector’s 5.64%. That ordering is the number Luanda has been chasing for a decade.
Diamonds fastest: Diamond extraction grew fastest at 16.46%, followed by information and communication at 14.30% and hospitality at 12.59%.
Quarter on quarter: Adjusted for seasonality, output rose 2.75% from the first quarter.
Size of the economy: At current prices, quarterly GDP reached 43.43 trillion kwanzas (about US$47.5 billion).
Year to date: Cumulative growth for 2026 stands at 7.15% against the same period of 2025.
The timing: The bulletin landed as African Union leaders arrived in Luanda for an extraordinary summit on 29 and 30 August.
Angola GDP growth reached 8.74% year on year in the second quarter of 2026, with the non-oil economy up 9.24% and oil up 5.64%, according to the National Statistics Institute. Diamond mining was the fastest-growing activity in the quarter.
Kwanza conversions in this piece use a late-August 2026 market rate of about 915 kwanzas per US dollar.
What the Angola GDP growth figures actually show
The National Statistics Institute, known by its Portuguese initials INE, published its quarterly national accounts bulletin on Friday. It put real growth at 8.74% against the same quarter of 2025, so the headline is a year-on-year comparison.
The split inside that number is the interesting part. Non-oil activity grew 9.24%, comfortably ahead of the 5.64% recorded by oil.
Measured at current prices, the quarter’s output came to 43.43 trillion kwanzas (about US$47.5 billion). On a seasonally adjusted basis, the economy grew 2.75% from the first quarter.
Diamonds, data and hotels did the heavy lifting
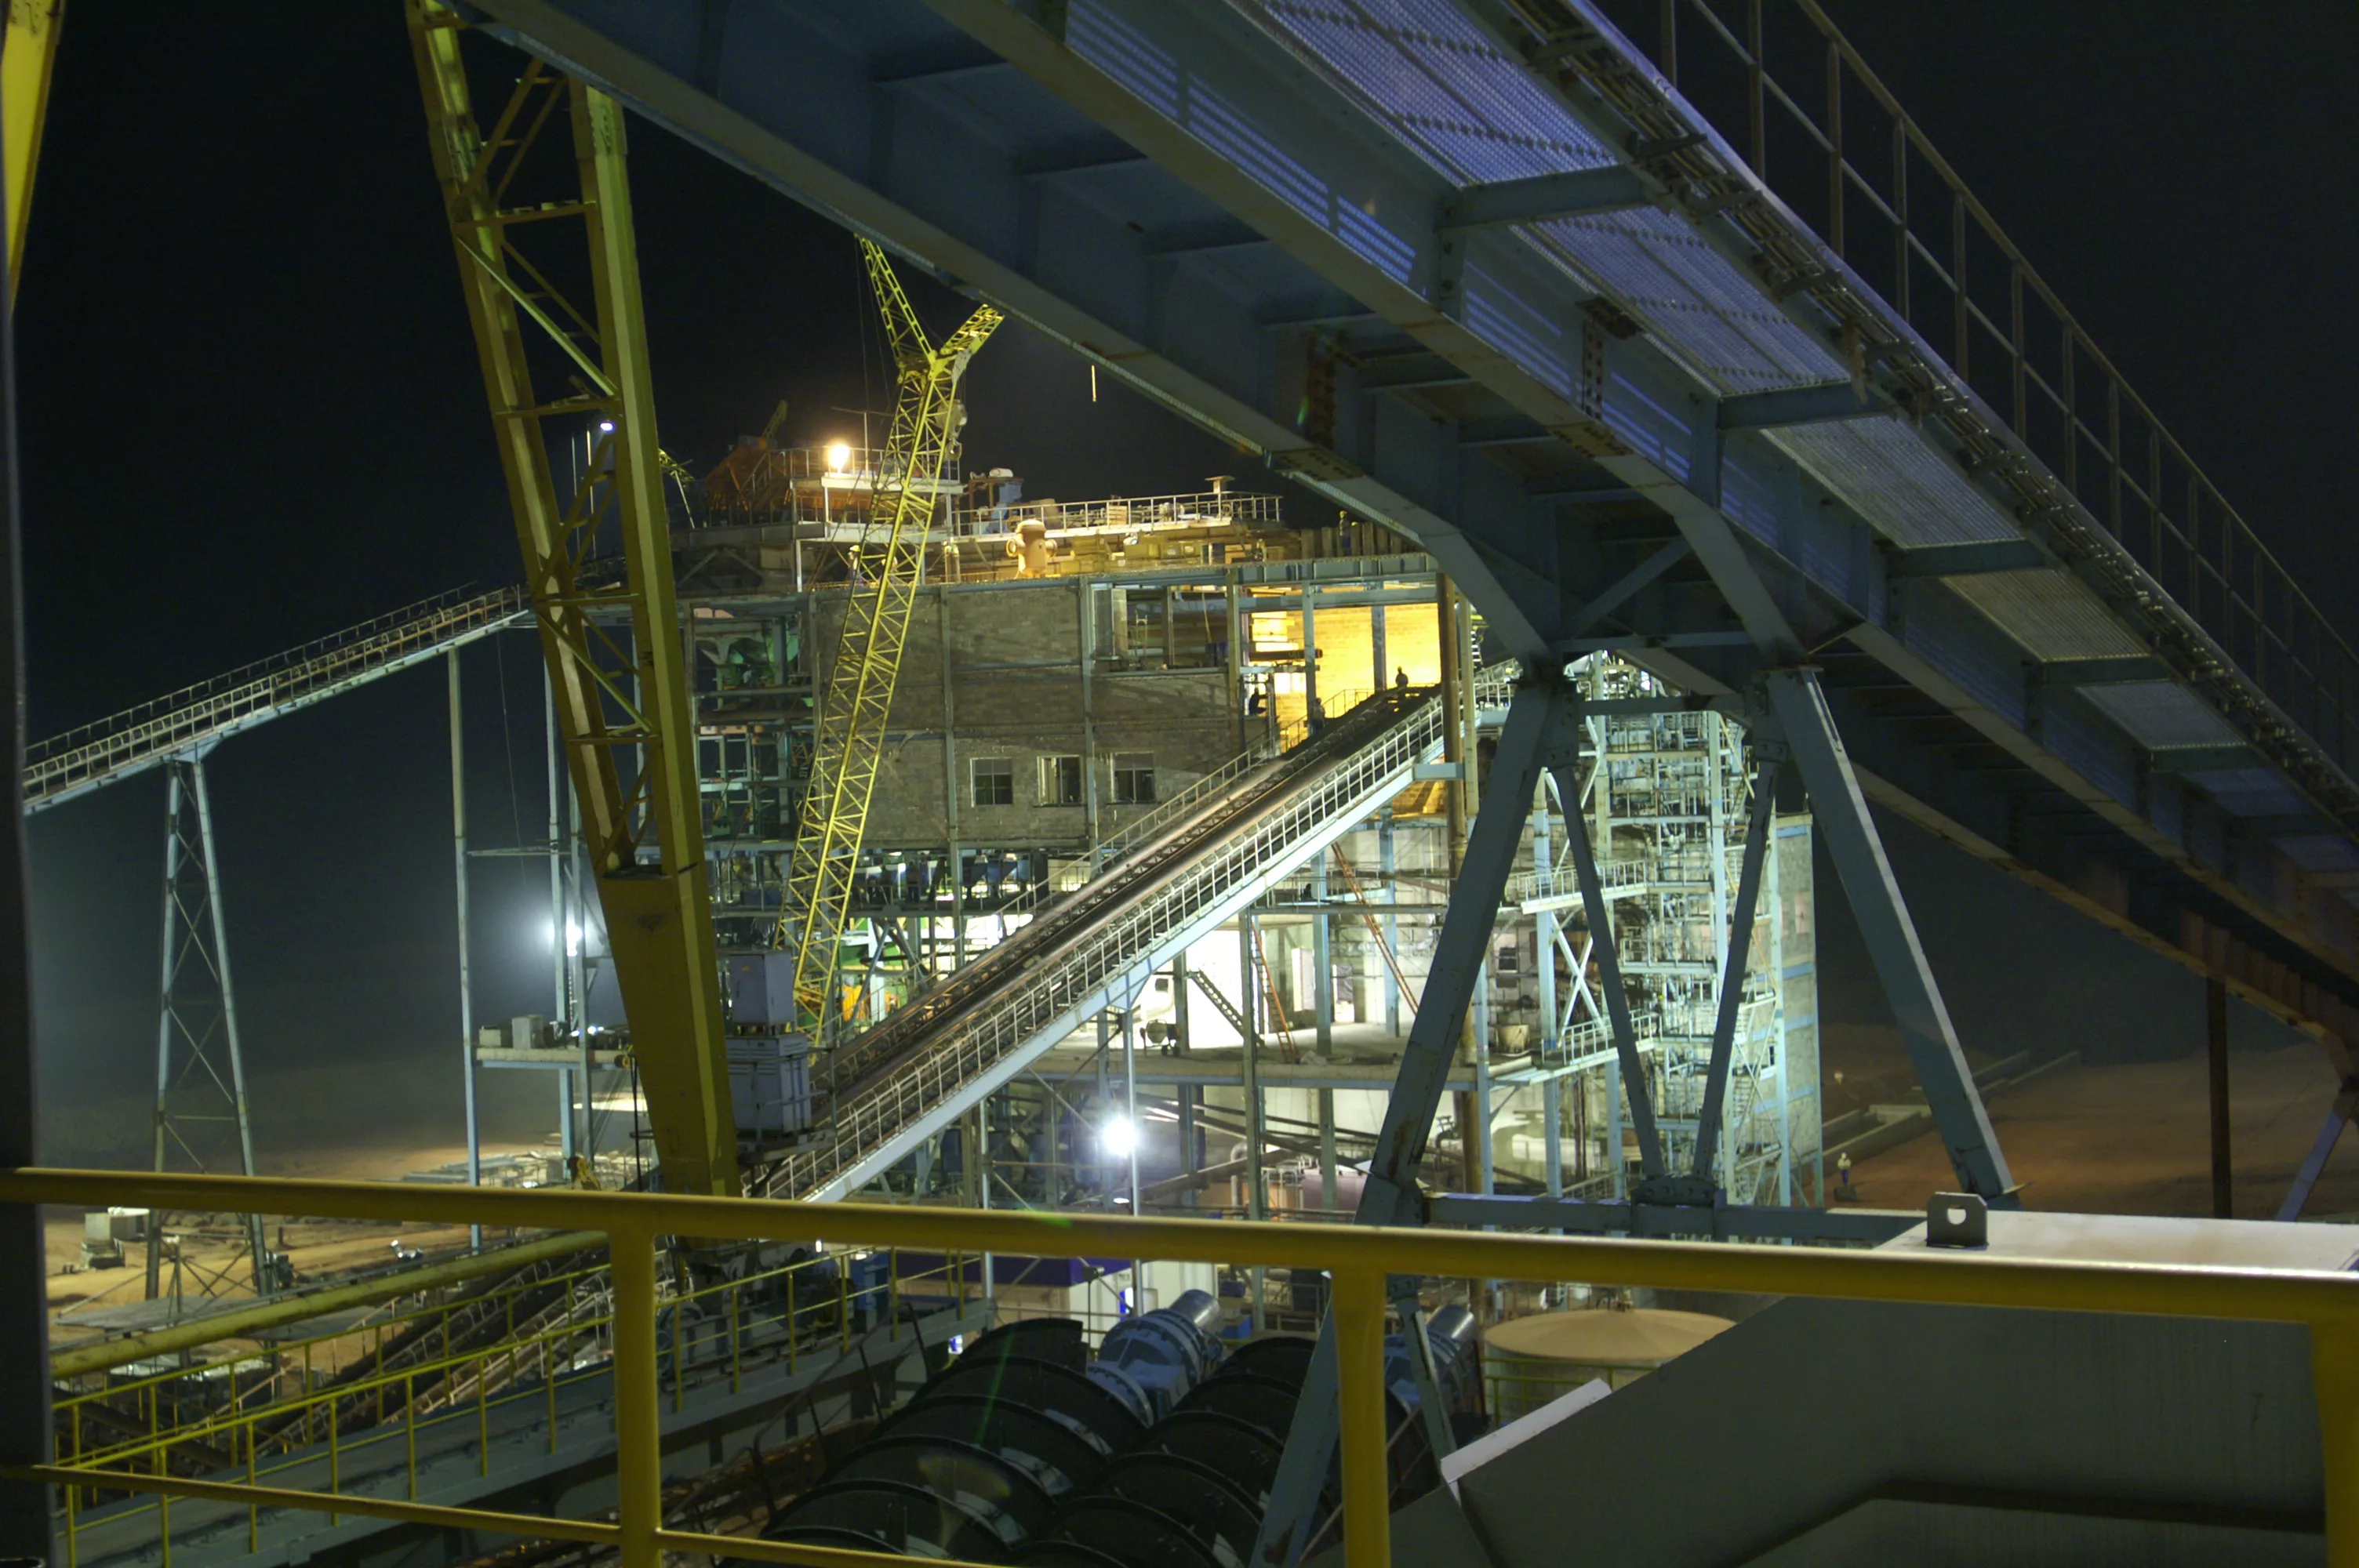
Diamond extraction was the fastest-growing activity of the quarter, up 16.46% year on year. Angola has spent recent years reopening the sector to private and foreign operators.
Information and communication came next at 14.30%, followed by accommodation and food service at 12.59%. Manufacturing rose 12.22% and financial intermediation and insurance 11.83%.
Measured by contribution to the overall growth rate rather than speed, trade and vehicle repair did the most work at 1.67 percentage points. Manufacturing followed at 1.48 points, oil extraction and refining at 1.03 points, and information and communication at 1.02 points.
That list reads like a service and consumption economy finding its feet. It is also, for once, a list in which oil does not dominate.
A cushion, not a cure, for the public finances
The INE bulletin carried one detail worth pausing on. Subsidies on products exceeded taxes on products, leaving net product taxes at minus 149.13 billion kwanzas (about US$163 million).
In plain terms, the state is paying out more in product subsidies than it collects in product taxes. That is a real cost sitting underneath a strong growth print.
It matters because Angola’s fiscal position has been deteriorating even while output improved. We reported in August that the deficit more than quadrupled in the first half while oil prices were still rising.
Why the number lands at a convenient moment
Angola is hosting an extraordinary African Union summit in Luanda on 29 and 30 August, devoted to conflict prevention. Heads of state, foreign ministers and a large press corps are in the city.
A growth figure of this size, published on the eve of that gathering, is a useful calling card. Luanda has been marketing itself as a logistics and investment hub rather than simply an oil exporter.
The Lobito Corridor sits at the centre of that pitch, linking Congolese and Zambian copper to the Atlantic. Angola’s diplomacy and its infrastructure strategy are now hard to separate.
What to watch next
One quarter is one quarter, and quarterly national accounts in frontier economies are revised often. The cumulative figure of 7.15% for the year to date is the steadier guide.
The question is whether non-oil growth holds once base effects fade. Diamond output, hospitality and telecoms are all cyclical in their own ways.
Investors will also want to see the subsidy line move. Growth that depends on subsidised fuel and utilities is growth with a bill attached.
How these numbers are compiled, and why that matters
Quarterly national accounts in frontier economies carry wide margins. INE publishes a quick-information sheet alongside the fuller bulletin, and figures are commonly revised in later releases.
The 8.74% reading is a year-on-year comparison against the second quarter of 2025. Base effects can flatter or punish any single quarter without saying much about the underlying trend.
That is why the cumulative 7.15% figure is the more useful guide for anyone sizing the economy. It smooths the quarter-to-quarter noise that a single print carries.
None of this changes the direction of travel. Another year of expansion led by the non-oil economy would mark a genuine structural shift for Angola after its long post-2014 recession.
The next quarterly bulletin is the one to watch, and it will land after the summit traffic has cleared Luanda. Until then, the honest reading is a strong quarter rather than a settled trend.
Background: our latin america economy guide.
Frequently asked questions
How fast did Angola’s economy grow in the second quarter of 2026?
Angola GDP growth was 8.74% year on year in the second quarter of 2026, according to the National Statistics Institute. Adjusted for seasonality, output rose 2.75% from the first quarter.
Was the growth driven by oil?
No. The non-oil economy grew 9.24% while the oil sector grew 5.64%, so non-oil activity led the quarter.
Which sectors grew fastest?
Diamond extraction led at 16.46%, followed by information and communication at 14.30% and accommodation and food service at 12.59%. Manufacturing rose 12.22% and financial services 11.83%.
How large is Angola’s quarterly economy in money terms?
At current prices, second-quarter GDP reached 43.43 trillion kwanzas (about US$47.5 billion). Cumulative growth for 2026 stands at 7.15%.
Connected Coverage
For the wider picture, see our pillar on Africa: The New Scramble and the rest of our Southern Africa coverage. We reported in August on Angola’s deficit more than quadrupling while oil prices rose, and this week on Kinshasa and Luanda pushing a shared oil zone and a fuel deal.
More Africa news: Nigeria | South Africa | Kenya | Egypt | Ghana | Morocco | DR Congo | Angola | Ethiopia | Tanzania
This article was produced by The Rio Times’ automated newsroom system. How we use AI · Report an error · Editorial responsibility: Matthias Camenzind, Editor-in-Chief
LatAm Markets: Live Signals → — real-time movers, turnover leaders and FX across Latin America.