EGX30 Slips 0.66% to 53,553 on Foreign Selling | Egypt Market Report, Oct 5
Key Facts
- Egyptian stocks gave back part of their rebound: the EGX30 fell on Monday after two straight gains, on a day of net selling by foreign and Arab investors in Cairo
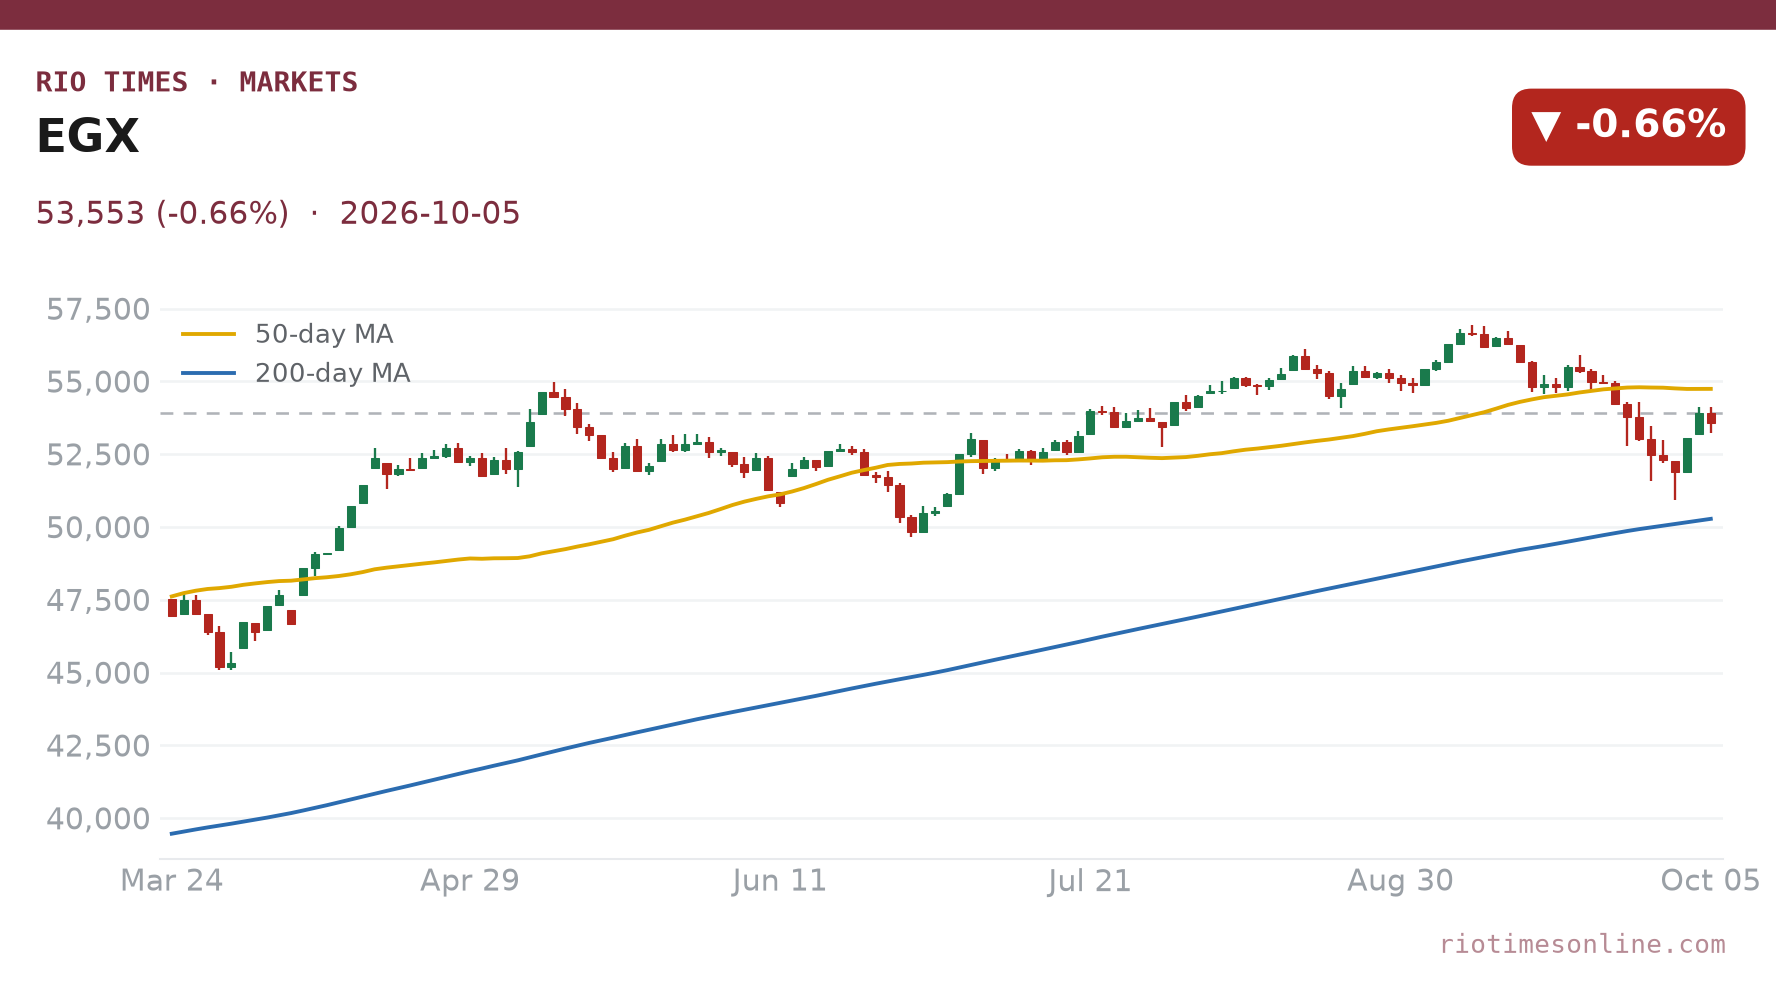
- The EGX30 fell 0.66% to 53,553.41 points, trading between 53,213 and 54,113, and is still up 28.03% since the end of 2025
- Small and mid-caps fell harder: the equal-weighted EGX70 and EGX100 both lost 0.89%, with 151 shares falling, 61 rising and 10 unchanged
- Foreign investors were net sellers of about EGP521 million (US$10.0 million), while Egyptian investors bought a net EGP582 million (US$11.1 million)
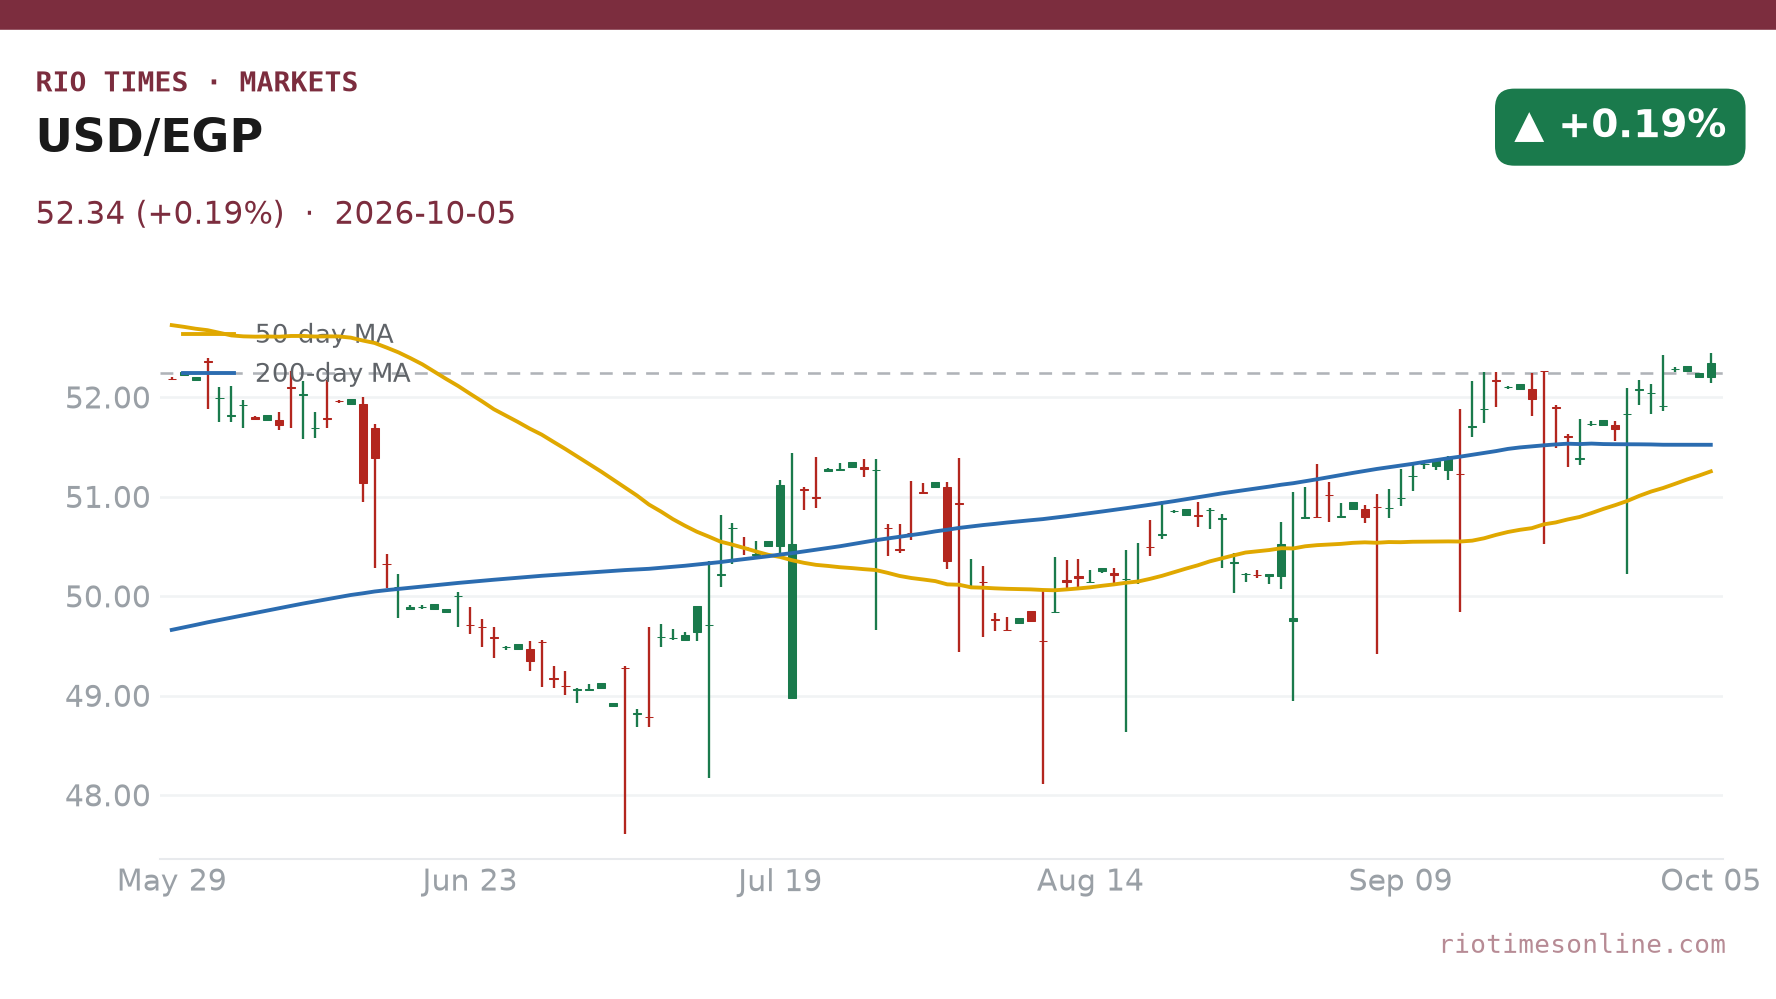
- The pound eased 0.19% to 52.34 per US dollar; the S&P Global PMI for non-oil business fell to 47.2 in September, below the 48.9 forecast
- Interest rates stay on hold at 19.00% (overnight deposit rate) until the next decision on 29 October; the exchange is expected to be closed on Thursday 8 October for Armed Forces Day
Today’s Focus
Egypt’s stock market took a breather on Monday. The EGX30, the main index of the Egyptian Exchange (EGX) in Cairo, fell 0.66% to 53,553.41 points, after gains of 2.24% on Thursday and 1.61% on Sunday.
The index touched 54,113 during the session, but sellers took over and it closed below the previous close.
Foreign and Arab investors were net sellers. Egyptian investors, who account for about 86% of turnover, were net buyers and kept the fall in check. For US investors, the pattern matters: the rebound has so far been led by locals, not by foreign money.
The Egyptian pound weakened slightly to 52.34 per US dollar. A separate report showed the non-oil economy shrank faster in September.
What matters today. The market has two sessions left this week, on Tuesday and Wednesday. The exchange then closes for a holiday and reopens on Sunday 11 October.

01 The session in one read
The EGX30, which tracks the 30 largest and most-traded companies on the Egyptian Exchange, lost 357.69 points, or 0.66%, to close at 53,553.41 on Monday 5 October. It opened at 53,911.10, the previous close, and touched 54,113 before sliding to a low of 53,213.
The fall follows a sharp two-day recovery. Even after Monday’s dip, the EGX30 is 0.94% above its 1 October close of 53,055.03 and 3.2% above its 30 September close of 51,894.83.
Breadth was weak. According to Egyptian press reports of the closing data, 151 shares fell, 61 rose and 10 were unchanged. The EGX70, an equal-weighted index of small and mid-sized companies, lost 0.89% to 19,776.31. The EGX100, which combines both groups, also lost 0.89%, closing at 26,132.88. Equal weighting means each company counts the same, so these gauges show how the typical stock performed.
Turnover on shares was about EGP9.5 billion (about US$180 million). The exchange’s market value fell by about EGP24 billion (about US$460 million) to EGP4.239 trillion (about US$81.0 billion).
The pound weakened 0.19% to 52.34 per US dollar. A weaker pound cuts the dollar value of Egyptian shares for foreign holders.
The size of the fall was modest, and the index held above Sunday’s low of 53,208. That points to a pause rather than a reversal. But the buyers are mostly local: foreign investors sold on Monday, as they did on Sunday. Without foreign money, rallies in Cairo tend to stall. The weak PMI adds to the caution, because it shows that the underlying economy is not yet improving.
02 The day’s numbers
| Measure | Level | Change | Read |
|---|---|---|---|
| EGX30 | 53,553.41 | −0.66% | Gives back part of Sunday’s 1.61% gain |
| EGX70 EWI | 19,776.31 | −0.89% | Small and mid-caps retreat |
| EGX100 EWI | 26,132.88 | −0.89% | Broad market follows the small-cap move |
| USD/EGP | 52.34 | +0.19% | Pound eases; day’s range 52.14 to 52.44 |
| EGX30, week to date | 53,553.41 | +0.94% | Up from 53,055.03 on Thursday 1 October |
| EGX30, year to date | 53,553.41 | +28.03% | From 41,828.97 at the end of 2025 |
| Advancers / decliners | 61 / 151 | 10 unchanged | 61 rose, 151 fell |
The EGX30’s highest close of the past 52 weeks was 56,676.16 points on Sunday 6 September 2026. Monday’s close leaves the index about 5.5% below that peak. In September alone the index lost 5.42%, but it still ended the third quarter 2.79% above its 30 June close.
The pound has weakened since late summer. Its weakest close of the past year was 54.65 per US dollar on Wednesday 8 April 2026, about 4.4% away from Monday’s level.
Live Market IntelligenceGlobal Markets — Live Board
Rio Times · Live Market Intelligence
Global Markets — Live Board
| Instrument | Last | Change | YoY | Prev. | High | Low | Volume |
|---|---|---|---|---|---|---|---|
| SPX | 7,751 | +0.29% | — | — | — | — | — |
| NDX | 29,799 | +0.93% | — | — | — | — | — |
| DJI | 53,810 | +0.03% | — | — | — | — | — |
| RUT | 3,041 | +0.46% | — | — | — | — | — |
| US10Y | 4.6760 | -0.17% | — | — | — | — | — |
| VIX | 14.60 | -4.45% | — | — | — | — | — |
| DAX | 26,331 | -0.23% | — | — | — | — | — |
| FTSE | 10,833 | -0.10% | — | — | — | — | — |
| CAC | 8,675 | -0.46% | — | — | — | — | — |
| STOXX | 659.48 | -0.16% | — | — | — | — | — |
| NIKKEI | 67,524 | +0.83% | — | — | — | — | — |
| HSI | 25,440 | -0.83% | — | — | — | — | — |
| KOSPI | 6,579 | +3.68% | — | — | — | — | — |
| CSI300 | 4,691 | +0.58% | — | — | — | — | — |
| NIFTY | 24,436 | -0.15% | — | — | — | — | — |
| TSX | 36,619 | +0.39% | — | — | — | — | — |
| GOLD | 4,461 | +1.78% | +33.20% | 4,383 | 4,503 | 4,421 | 139,824 |
| SILVER | 65.59 | +1.26% | +73.05% | 64.77 | 66.98 | 64.81 | 46,406 |
03 Why it moved: profit-taking and a weak economy
No single piece of Egyptian news explained Monday’s fall. The likeliest reading is profit-taking. The EGX30 had gained 3.9% in two sessions, and some investors chose to bank those gains.
Foreign selling added pressure. Egyptian press reports of the closing data show foreign investors sold a net EGP521.4 million (US$10.0 million) and Arab investors a net EGP60.3 million (US$1.2 million). Egyptians bought a net EGP581.7 million (US$11.1 million) and made up 85.97% of turnover.
The economic backdrop was soft. S&P Global’s Egypt PMI (listed by the RT calendar as the Composite PMI), a monthly survey of non-oil private companies, fell to 47.2 in September from 49.6 in August. Any reading below 50 signals contraction. The survey was published on Monday morning.
Monetary policy gave no fresh push. The CBE held its key rates on 24 September. The overnight deposit rate stays at 19.00% and the lending rate at 20.00%. High rates make bank deposits a strong rival to shares for Egyptian savers.
04 Today’s data, one by one
The RT calendar lists one Egyptian release for Monday. These are the items that shaped the day and the week.
S&P Global Egypt PMI, September (published Monday 5 October). The headline index fell to 47.2, against a forecast of 48.9 and 49.6 in August. Output and new orders fell sharply, as weaker demand, geopolitical disruption and high inflation weighed on firms. Purchasing activity contracted for a sixth month in a row. Employment rose for a second month, the first back-to-back rise in more than a year. Companies still expect higher output over the next 12 months, though confidence weakened from August’s four-year high. Costs stayed high on oil, metals, electricity and transport. A PMI is a survey index: it is an early signal of business conditions, not an official statistic.
Interest rates (CBE), 24 September. The Monetary Policy Committee held the overnight deposit rate at 19.00%, the overnight lending rate at 20.00% and the main operation rate at 19.50%. It was the fifth meeting in a row without a change. The only move this year was a cut of 100 basis points in February. The next meeting is on Thursday 29 October.
Inflation (CAPMAS), August. Annual urban inflation slowed to 14.5% from 14.9%, according to CAPMAS, Egypt’s statistics agency. Core inflation stood at 14.9%.
Holiday schedule. The Egyptian Exchange is expected to be closed on Thursday 8 October for Armed Forces Day. The government moved the holiday from Tuesday 6 October. Banks are closed on the same day, and both reopen on Sunday 11 October.
05 The day’s movers
| Driver | Close | Change | Note |
|---|---|---|---|
| Commercial International Bank (COMI) | EGP126.05 (US$2.41) | −0.74% | Most-traded name in this table: about EGP608m (US$11.6m) |
| Qalaa Holdings (CCAP) | EGP6.77 (US$0.13) | −0.59% | About EGP477m (US$9.1m) traded |
| EFG Holding (HRHO) | EGP26.05 (US$0.50) | +0.19% | About EGP442m (US$8.4m) traded |
| Telecom Egypt (ETEL) | EGP151.00 (US$2.88) | +0.61% | About EGP260m (US$5.0m) traded |
| Talaat Moustafa Group (TMGH) | EGP88.90 (US$1.70) | +0.02% | About EGP201m (US$3.8m) traded |
| Fawry (FWRY) | EGP18.85 (US$0.36) | −1.31% | About EGP162m (US$3.1m) traded |
| Abu Qir Fertilizers (ABUK) | EGP86.88 (US$1.66) | −1.97% | Weakest of the heavily traded names here; about EGP59m (US$1.1m) traded |
Trading values in the table are estimates based on closing price and share volume. Commercial International Bank (CIB), a heavyweight in the EGX30, led turnover among the names we track. Qalaa Holdings, an investment company with stakes in energy and industry, and EFG Holding, a Cairo-based investment bank, followed.
Telecom Egypt, the state-backed fixed-line operator, rose 0.61%. Fawry, a payments company, lost 1.31%. Abu Qir Fertilizers fell 1.97%.
With only 61 shares higher across the market, gains in the big names were scarce.
06 The regional scoreboard
| Index | Country | Change |
|---|---|---|
| EGX70 EWI | Egypt | −0.89% |
| EGX100 EWI | Egypt | −0.89% |
| EGX30 | Egypt | −0.66% |
The fall was not part of a regional rout. It reflects local factors: profit-taking after a fast rebound, foreign selling and a weak PMI.
07 The technical picture
The EGX30 closed at 53,553.41, about 5.5% below its 52-week closing high of 56,676.16. The index crossed 54,000 intraday on Sunday and again on Monday but could not hold the level at the close. A close above 54,000 would be the first sign that buyers are regaining control.
On the downside, the session low of 53,213 matches Sunday’s low of 53,208, so the 53,200 area is the first support. A close below it would put the low of 1 October, 51,884, back in view.
For the pound, the day’s range ran from 52.14 to 52.44 per US dollar. Its weakest close of the past year, 54.65 in April, is about 4.4% away from Monday’s level.
08 What to watch
- Tuesday 6 and Wednesday 7 October: The last two sessions before the holiday; the exchange is then expected to be closed on Thursday 8 October and reopens on Sunday 11 October
- Foreign reserves, Wednesday 7 October: The CBE’s September figure is due; the RT calendar shows a forecast of US$57.5 billion against US$57.22 billion in August
- Inflation: September urban inflation is listed for around 8 October with a forecast of 13.9%, against 14.5% in August; that day is a public holiday, so timing may shift. A further fall would strengthen the case for rate cuts
- The pound: Whether it holds near 52 per US dollar or slides further, a key test for foreign investors
- CBE meeting, 29 October: The Monetary Policy Committee’s next rate decision, with the deposit rate at 19.00%
Background: Egypt Economy 2026: Pound Steady Near 51 as the IMF Test Approaches, Egypt’s Reserves Passed US$57bn, and Gold Did the Heavy Lifting and more from our Egypt news hub.
Frequently Asked Questions
What is the EGX30?
It is the main stock index of the Egyptian Exchange in Cairo, tracking the 30 largest and most-traded listed companies.
Why did Egyptian stocks fall on 5 October 2026?
The EGX30 lost 0.66% to 53,553.41 points after two straight gains. The likeliest drivers were profit-taking, net selling by foreign investors of about EGP521 million (US$10.0 million) and a weak PMI reading of 47.2.
What does a PMI of 47.2 mean?
The S&P Global Egypt PMI surveys non-oil private companies. A reading below 50 signals that business conditions are getting worse. September’s 47.2 was down from 49.6 in August and below the 48.9 forecast.
When does the Egyptian stock market trade?
The Egyptian Exchange trades from Sunday to Thursday. It is expected to be closed on Thursday 8 October for Armed Forces Day, so the last session of the week is Wednesday 7 October, and trading resumes on Sunday 11 October.
Source: RT market data, close of Monday 5 October 2026; exchange figures from the Egyptian Exchange as reported by Masrawy and Hapi Journal; interest rates from the Central Bank of Egypt; inflation from CAPMAS; PMI from Asharq Al-Awsat and S&P Global; holiday from Arab Finance.
This article was produced by The Rio Times’ automated newsroom system. How we use AI · Report an error · Editorial responsibility: Matthias Camenzind, Editor-in-Chief
LatAm Markets: Live Signals → — real-time movers, turnover leaders and FX across Latin America.
Get The Rio Times delivered to your inbox — market intelligence, daily briefs, and breaking analysis across Latin America.
Start for US$1