Chile and Argentina Lift Lithium Output as US and China Race for Andean Supply
Markets · Latin America
—The stakes. Latin America’s lithium triangle and copper belts make the region indispensable for the energy transition’s raw materials.
—The date. As of September 2026, Chile and Argentina together produced about 79,000 tonnes of lithium metal content in 2025.
—The actors. State firms SQM, YLB and Codelco operate alongside foreign owners from Canada, China, Australia and the United States.
—The risk. Resource nationalism in Chile and Bolivia coexists with Argentina’s fully liberalised mining regime.
—The opportunity. Brazil’s niobium and rare earth push adds another layer of strategic weight for investors in battery and grid metals.
Latin America’s critical minerals map now looks less like a single lithium triangle and more like a contested chain of copper, rare earth and niobium supply lines. Chile and Argentina are finally converting resources into output, while Bolivia remains a giant resource holder with almost no commercial production.
A region that cannot be ignored
The U.S. Geological Survey cites Chile and Peru as producing over 34% of global copper in 2024. Chile, Argentina and Brazil together contributed 32% of global lithium production.
The lithium triangle of Argentina, Bolivia and Chile holds about 64 million tonnes of the 150 million tonnes of lithium resources the US Geological Survey identifies worldwide, roughly 43 percent. One geopolitical analysis estimates Latin America holds over 60% of global lithium reserves and about 40% of world copper reserves.
Foreign ownership of critical mineral mines in Latin America remains heavily Western. Canada owns 35%, the United States 16%, Australia 12% and the United Kingdom 10%.
China’s direct mine ownership is only 9.6%, but its role in processing and offtake agreements extends far beyond equity stakes. In lithium mining specifically, Canada holds 42% of mine ownership, China 24%, Australia 20% and the United States 17%.
This ownership structure means Washington and Beijing both depend on Latin American projects they do not fully control. That dependence is now shaping trade policy and investment diplomacy across the region.
The lithium triangle’s uneven production map
Chile produced 56,000 tonnes of lithium metal content in 2025, according to USGS data summarised in a 2026 resource market analysis. Argentina produced 23,000 tonnes in the same year.
Together that represented about 27% of world mine output of 290,000 tonnes, excluding the United States. Bolivia is not reported separately in the USGS 2025 mine production table.
A 2026 explainer notes Chile produced about 49,000 tonnes in 2024, while Argentina produced around 18,000 tonnes. Bolivia’s commercial output remains measured in the hundreds of tonnes despite holding the largest resource base.
The U.S. International Trade Administration reports Chile contained 36% of world lithium reserves. Its output rose from 44,300 tonnes of metal content in 2023 to 49,000 tonnes in 2024.
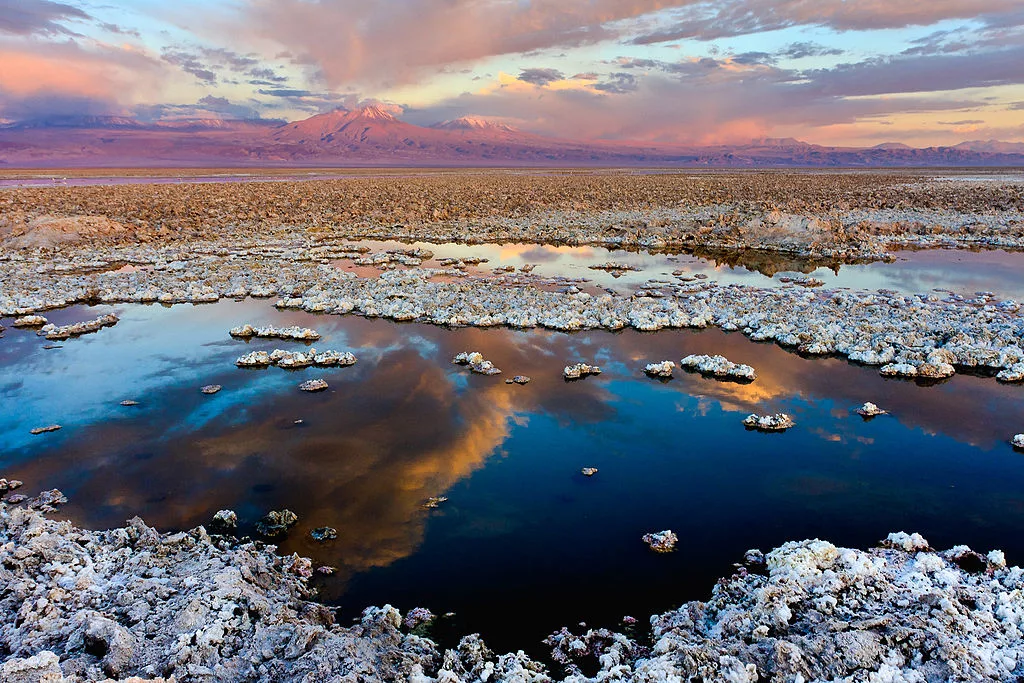
Production remains concentrated in brine deposits beneath the Salar de Atacama. Only two companies produce in Chile: SQM, in which China’s Tianqi holds 22.16%, and Albemarle Chile Ltda.
Chile’s state-led strategy under Boric
President Gabriel Boric announced Chile’s National Lithium Strategy on April 20, 2023. All future lithium projects must be structured as public-private partnerships with majority state control.
Codelco and SQM completed their joint venture on 27 December 2025, creating NovaAndino Litio SpA with Codelco holding 51%, mining rights in the Salar de Atacama to 2060 and up to 85% of lithium profits accruing to the state from 2031. Chile’s Supreme Court dismissed Tianqi’s final challenge in January 2026. This policy shifted the investment framework from a concession model to one requiring state participation.
SQM has nevertheless expanded capacity aggressively. Its lithium carbonate plant reached 210,000 tonnes of lithium carbonate equivalent by 2024.
SQM plans to expand to 240,000 tonnes per year by late 2026 or early 2027. Lithium hydroxide capacity in Chile is planned to rise from 40,000 tonnes per year to 100,000 tonnes per year by the end of 2025.
A 2026 GlobalData briefing estimates Chile produced about 64,100 tonnes in 2025 and projects 67,300 tonnes in 2026, a wider measure than the US Geological Survey figure used above. Chile’s global market share has fallen from about 30% to under 25% as Australia, Argentina and China grow faster.
Argentina’s liberalised race to scale
Argentina’s provinces own the resources, and since July 2024 large projects can enter the RIGI regime, which fixes tax, customs and currency rules for 30 years. Rio Tinto’s Rincón project in Salta was admitted at about US$2.5 billion. This contrasts sharply with Chile and Bolivia.
Americas Quarterly reported Argentina produced 33,000 tonnes of lithium carbonate equivalent in 2022. A third mine came online in June 2023, with two more projects slated for completion in the following year.
Three additional projects were under construction, and 41 early-stage projects were identified beyond 2025. Argentina produced 23,000 tonnes of lithium content in 2025, roughly 3.7 times its 2022 level.
Fastmarkets’ ten-year forecast from 2024 to 2034 projects Argentina’s lithium production will grow at a 15% compound annual growth rate. It could reach 355,200 tonnes per year by 2034.
For investors, Argentina offers the fastest ramp-up among the triangle countries. The tradeoff is fiscal and political volatility at the federal and provincial levels.
Bolivia’s resource giant without output
Bolivia holds about 23 million tonnes of identified lithium resources, second in the triangle to Argentina’s 28 million. Its reserves are not clearly defined by USGS data.
A 2023 Americas Quarterly article reported Bolivia produced only about 600 tonnes of lithium carbonate equivalent in the prior year from a pilot plant at Uyuni.
Two projects worth about US$1.4 billion each were signed in 2023 and 2024 between state firm Yacimientos de Litio Bolivianos and Chinese and Russian partners, targeting Uyuni and Coipasa. Neither contract was ratified by the legislature, neither reached commercial production, and President Rodrigo Paz has said he will review them.
Bolivia created YLB in 2017 and pursues a monopoly on lithium, requiring state majority ownership and limiting foreign control. This legal framework has deterred many Western mining companies.
The gap between resource size and actual production means Bolivia’s role in global supply remains aspirational. Its strategic value is as a future swing supplier rather than a current market force.
Copper expansion in Chile and Peru
Chile and Peru accounted for over 34% of global copper production in 2024, according to USGS data cited in a 2025 investment analysis. No other region matches this concentration of mine supply.
Copper demand is driven by grid buildout, electric vehicles and data centre construction. Forecasts published in early 2024 saw copper rallying sharply on supply deficits, a call the market did not deliver in full.
Chile’s copper industry operates alongside its lithium strategy, with Codelco acting as the state’s main vehicle. Peru’s copper sector remains largely private and open to foreign investment.
Chinese and Western buyers both depend on Chilean and Peruvian copper concentrates. This dependency creates diplomatic clout for both South American governments.
Investors view copper as the more immediately constrained market compared to lithium. Mine permitting timelines in both countries remain a key bottleneck for new supply.
Brazil’s rare earth and niobium push
Brazil contributed to the region’s 32% share of global lithium production in 2024, alongside Chile and Argentina. Its mining sector extends far beyond lithium into niobium and rare earth elements.
Brazil is the world’s dominant niobium producer, a metal used in high-strength steel alloys. The country’s rare earth deposits are attracting new attention as Western buyers seek alternatives to Chinese processing.
Brazil’s mining code allows private ownership of mineral rights, unlike Bolivia’s monopoly model. This has encouraged exploration by Canadian, Australian and U.S. firms.
Brazil’s rare earth potential remains underexploited relative to its geological endowment. Processing capacity is the main constraint, as China still dominates separation and refining.
For investors, Brazil offers diversification away from lithium and copper exposure. Its niobium dominance provides a stable cash flow base while rare earth projects carry higher exploration risk.
US and Chinese competition for supply lines
China owns 9.6% of critical mineral mines in Latin America but exerts influence through offtake agreements, processing contracts and state-backed financing. In lithium mining, Chinese firms control 24% of mine ownership.
The United States owns 16% of regional critical mineral mines and 17% of lithium mines. Washington has sought to counter Chinese influence through development finance and trade agreements.
Canada’s 42% share of lithium mine ownership in Latin America makes it a quiet but decisive actor. Australian firms hold another 20%, reflecting the dominance of Western mining capital in the region.
Competition is sharpest in Argentina, where Chinese and Western companies operate parallel projects under the same liberal rules. In Chile and Bolivia, the state acts as gatekeeper, forcing partnerships on its own terms.
Investors should expect continued U.S. pressure on Latin American governments to limit Chinese equity in strategic projects. Beijing will respond with financing packages that Western development banks cannot match on speed.
Resource nationalism as a structural risk
Chile’s National Lithium Strategy and Bolivia’s YLB monopoly represent two forms of resource nationalism. Chile demands majority state partnership for new projects, while Bolivia requires state control outright.
Argentina stands as the regional counterexample, with no lithium-specific nationalisation threat. Provincial governments can still impose royalties or revoke licences, but the default is private ownership.
The 2025 resource nationalism paper notes Argentina’s open market model encourages foreign investment but exposes it to commodity price cycles. Chile’s partnership model slows project development but locks in state revenue.
Bolivia’s model has produced almost no commercial output despite the largest resource base. This shows that resource nationalism without technical capability can freeze development entirely.
For investors, the risk is not uniform across the region. It is concentrated in jurisdictions where the state demands equity but cannot deliver permits, infrastructure or processing technology.
What this means for energy transition investors
Latin America’s critical minerals map offers a rare combination of geological scale and political diversity. Investors can choose between Chile’s slow but stable partnerships, Argentina’s fast but volatile open market, and Brazil’s diversified mineral base.
Lithium prices remain the key short-term variable. Fastmarkets’ long-term forecast for Argentina assumes sustained demand growth, but near-term oversupply from Australia and China could delay project returns.
Copper offers a tighter supply-demand balance with fewer substitute materials. Chile and Peru will capture the majority of new copper investment over the next decade.
Brazil’s niobium provides a monopoly-like cash flow, while its rare earth projects are a longer-dated option on Western supply chain diversification. Both require tolerance for Brazilian regulatory complexity.
The core investment conclusion is that Latin America is not one risk profile. It is a portfolio of resource-rich jurisdictions with different rules, partners and time horizons, all tied to the same energy transition demand curve.
The region’s strategic grip on the transition
Latin America’s control of over 60% of global lithium reserves and about 40% of world copper reserves gives it structural weight over every battery and grid project worldwide. No energy transition plan can exclude the region.
That clout is still underused because production does not match resource endowment. The triangle holds about 64 million tonnes of identified resources but produces only a fraction of global supply.
Chile, Argentina and Brazil are now closing that gap through capacity expansion, while Bolivia remains a strategic reserve for future decades. This divergence will shape regional politics as much as global markets.
Foreign ownership patterns show the competition is not simply US versus China. Canadian and Australian mining capital holds significant positions, creating a multi-polar ownership structure.
Investors who understand these ownership layers and state strategies can position ahead of the next supply shock. Those who treat the region as a single lithium story will miss the copper, niobium and rare earth weight embedded in the same geography.
Connected Coverage
Bolivia Inflation Slows as Boliviano Loses Value
Argentina Trade Deficit With Brazil Widens on Month in August
The Big Picture
Read More from The Rio Times