US Trade With Central America Tops $86 Billion as Remittance Dependence Hits 26.6% in Nicaragua
Economy · Central America
—The stakes. Central America’s economies ride twin rails of US trade and remittances, making the region unusually sensitive to US policy shifts.
—The date. Full CAFTA-DR implementation began January 1, 2025, removing duties on virtually all eligible goods entering the United States.
—The trade picture. US goods trade with CAFTA-DR partners reached $86.4 billion in 2025, with a surplus of $7.6 billion favouring the United States.
—The dependence. Nicaragua and Honduras rely most heavily on remittances, at 26.6% and 25.7% of GDP respectively in 2024.
—The signal. Central America received an estimated $45.7 billion in remittances in 2024, with 73.5% of flows originating from the United States.
Central America’s economy enters 2026 caught between a fully implemented free trade framework and deep dependence on dollars sent home from the United States. The CAFTA-DR bloc has locked in duty-free access for almost all goods, yet remittance flows now exceed a quarter of GDP in two of its member states, leaving fiscal and social stability tied directly to US labour markets.
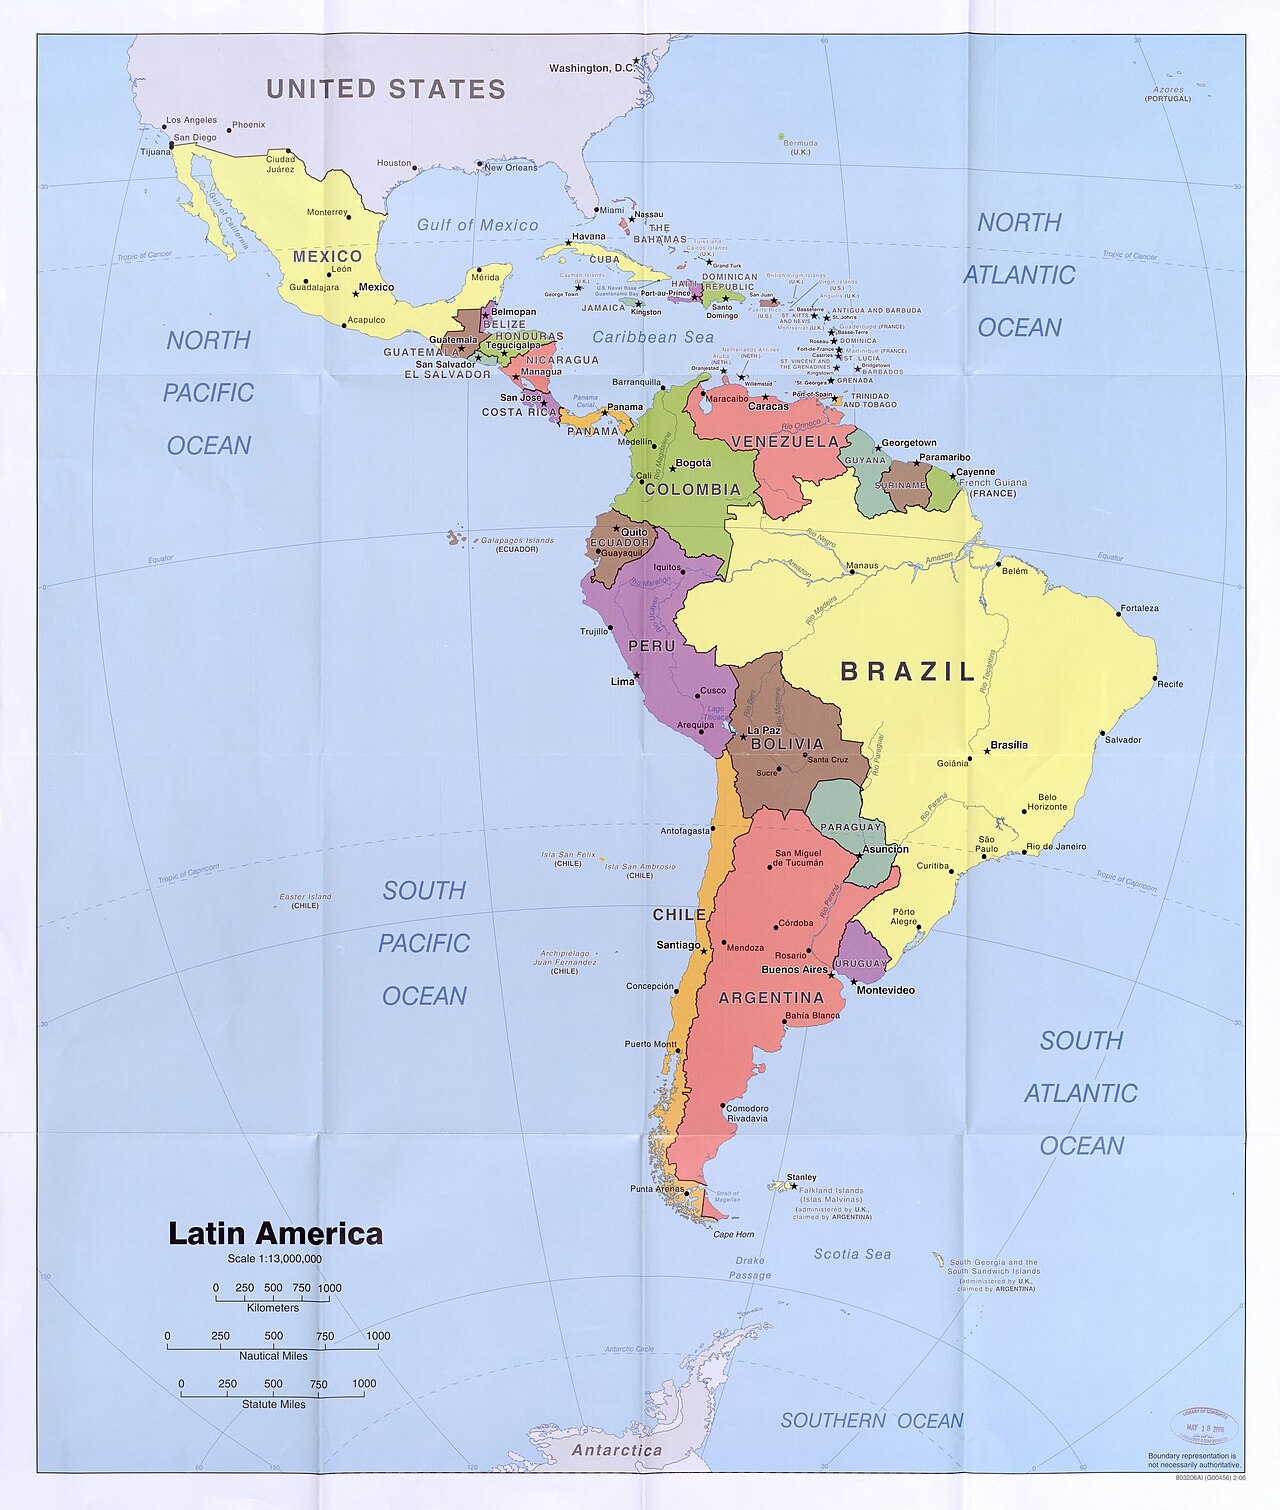
CAFTA-DR Trade Structure Matures in 2026
The Dominican Republic–Central America Free Trade Agreement, known as CAFTA-DR, links the United States with Costa Rica, El Salvador, Guatemala, Honduras, Nicaragua and the Dominican Republic. Panama is not part of the bloc.
The US Customs and Border Protection agency states that virtually all CAFTA-DR goods enter the United States free of duty and the merchandise processing fee. Full implementation of the agreement took effect on January 1, 2025.
The CAFTA-DR framework gives exporters in member countries predictable access to the world’s largest consumer market. That access is now fully phased in as of the start of last year.
US Goods Trade With the Bloc Reaches $86.4 Billion
The US Census Bureau reports total goods trade with CAFTA-DR partners of $86.4 billion in 2025. That figure combines $47.0 billion in US exports and $39.4 billion in imports.
The resulting goods trade surplus favouring the United States was $7.6 billion in 2025. Monthly balances remained positive throughout the year, ranging from $571.6 million in March to $1,179.1 million in January.
By December 2025, monthly exports stood at $3,814.4 million and imports at $3,226.2 million. This steady surplus reflects stronger US export momentum relative to purchases from the bloc.
Broader Trade in Services Widens the Relationship
The Office of the US Trade Representative reports that goods and services trade with CAFTA-DR totalled an estimated $108.5 billion in 2022. That combined measure includes service flows beyond the goods-only census data.
US exports of services to the bloc were estimated at $10.0 billion in 2022, up 11.4% from 2021. US imports of services from CAFTA-DR reached $14.6 billion, up 23.8% year over year.
Services trade has grown faster than goods trade since 2012. Service exports rose 45% and service imports rose 62% over that decade, indicating deepening cross-border commercial integration.
Remittance Dependence Reaches Extreme Levels
The Inter-American Development Bank, known as the IDB, estimates Central America received around $45.7 billion in remittances in 2024. That regional flow grew an estimated 6.6%, roughly half the growth rate observed in 2023.
Nicaragua shows the deepest dependence, with personal remittances equal to 26.6% of GDP in 2024. Honduras follows at 25.7% of GDP from a $37.1 billion economy.
El Salvador draws remittances worth 24.0% of GDP from a $35.4 billion economy. Guatemala, the region’s largest economy at $113.2 billion, relies on remittances for 19.1% of GDP.
Costa Rica is the clear outlier at just 0.8% of GDP from a $95.4 billion economy. Panama, though outside CAFTA-DR, receives remittances equal to roughly 0.6% of GDP.
United States Shares Most of the Remittance Burden
The IDB reports that 73.5% of remittances to almost all Central American countries originate from the United States. This concentration makes US economic conditions the primary external driver of household income across the region.
Across 2024 remittances rose 12.5% in Nicaragua, 8.6% in Guatemala, 6.2% in Honduras and 2.4% in El Salvador.
Growth then accelerated sharply in 2025 as migrants moved money ahead of tighter US policy. Flows rose 25.3% in Honduras, 18.9% in Nicaragua, 18.7% in Guatemala and 17.8% in El Salvador, and in the first half of 2026 the three northern countries together recorded growth of 7.8%.
Migration Economics Anchor Household Budgets
The Latin American Economic Outlook 2024, published by the OECD, CAF and UN ECLAC, reports remittances equalled 12.7% of Central American GDP in 2023. That compares with 9.4% in the Caribbean and only 0.7% in South America.
The World Bank notes that Nicaraguan flows have kept growing, reaching US$6.2 billion in 2025. Migration and remittance channels are now tightly intertwined across the northern triangle.
Per capita remittances reached about US$1,569 in El Salvador and US$1,366 in Guatemala in 2025. Honduras records about US$1,110 per person and Nicaragua about US$885.
Regional Growth Slows After Post-Pandemic Surge
The IDB reports remittances to all of Latin America and the Caribbean reached $160.9 billion in 2024. That was a 5.0% increase over 2023, the lowest annual growth rate in ten years.
Central America accounted for 28.3% of all remittance flows to the region in 2024. The share remained similar to 2023 despite the slowdown in overall growth rates.
Remitscope, an IFAD tool using central bank data, estimates $166 billion in total remittance inflows to Latin America and the Caribbean in 2024. It notes 24% of LAC countries depend on remittances for at least 4% of GDP.
Nearshoring Winners Emerge Within CAFTA-DR
The fully implemented CAFTA-DR agreement strengthens the case for shifting production closer to the United States. Duty-free access lowers costs for manufacturers in member states competing for US-bound orders.
Costa Rica’s low remittance dependence at 0.8% of GDP points to a more diversified export base. The country’s $95.4 billion economy relies on tradable goods and services rather than household transfers.
Guatemala and Honduras are pursuing export growth alongside heavy remittance reliance. The combination creates economies where domestic consumption and basic imports are financed partly by US-based workers.
Panama, outside CAFTA-DR, offers a logistics corridor rather than duty-free manufacturing access. Its minimal remittance exposure of about 0.6% of GDP reflects a services-based trade model.
US Policy Under the Current Administration
The current administration inherited a fully implemented trade agreement that took effect at the start of 2025. The CAFTA-DR framework remains the legal backbone of US goods trade with the bloc.
US goods exports to CAFTA-DR totalled $47.0 billion in 2025 while imports reached $39.4 billion. The $7.6 billion surplus gives Washington limited incentive to reopen the trade architecture.
Migration enforcement and protection status decisions remain the key US policy levers affecting the region. Changes to work authorisation or deportation policy would flow directly into remittance volumes.
The World Bank links remittance growth to US labour market strength more than to regional policy. Any cooling of US hiring would slow the household transfers that anchor Central American consumption.
What This Means for the Region in 2026
Central America begins 2026 with full duty-free access to the US market through CAFTA-DR. Exporters in six member economies can now plan around a completed tariff schedule with no further phase-ins.
The bloc’s remittance dependence remains the single largest structural vulnerability. Nicaragua, Honduras and El Salvador all exceed 24% of GDP in remittance reliance, tying fiscal and social stability to US conditions.
Investors watching the Central America economy should track US labour data and migration enforcement together. Both channels transmit directly into household income, import demand and currency stability across the region.
Costa Rica and Panama offer the least remittance-dependent exposure for foreign capital. Their economies provide a hedge against US labour market slowdowns while retaining trade links to the United States.
Connected Coverage
El Salvador Wins IMF Staff-Level Agreement Worth US$140 Million
The Big Picture
Latest developments
- Marco Antonio Solís Performs in Medellín on 27 November — 5 October 2026
- Jack White in Nairobi: Masshouse Show on 18 December — 5 October 2026
- Cairo International Film Festival 2026: 11 to 20 November — 5 October 2026
- U-17 Women’s World Cup in Rabat-Salé: USA Opens 19 October — 5 October 2026
This article was produced by The Rio Times’ automated newsroom system. How we use AI · Report an error · Editorial responsibility: Matthias Camenzind, Editor-in-Chief
LatAm Markets: Live Signals → — real-time movers, turnover leaders and FX across Latin America.