IBOV 185,188.13 ▼ 0.01% IPSA 11,315.26 ▼ 1.14% IPC MEX 65,473.16 ▲ 0.91% MERVAL 3,058,093 ▼ 1.55% COLCAP 2,534.46 ▲ 1.81% BVL PERÚ 59,719.97 ▲ 0.43% USD/BRL5.10▲ 0.17% USD/MXN16.88▼ 0.22% USD/CLP930.46▼ 0.76% USD/COP3,138▼ 0.68% USD/PEN3.35▼ 0.34% USD/ARS1,508▼ 0.17% USD/UYU40.23▲ 1.13% USD/PYG5,924▲ 2.31% USD/BOB12.30▲ 4.75% USD/DOP58.65▲ 0.17% USD/CRC447.49▲ 1.34% USD/GTQ7.63▲ 2.30% USD/HNL26.84▲ 1.66% USD/NIO36.62▲ 0.07% USD/VES805.37▲ 0.19% USD/PAB1.00— 0.00% USD/BZD2.00— 0.00% USD/JMD 157.28 — 0.00% USD/TTD6.65▲ 0.05% EUR/BRL5.93▼ 0.62% BRENT 88.88 ▼ 0.03% WTI 83.11 ▼ 0.11% IRON ORE 161.91 — — COPPER 6.61 ▲ 0.03% GOLD 4,461 ▲ 1.78% SILVER 65.59 ▲ 1.26% SOY 1,184 ▲ 3.20% CORN 480.50 ▲ 10.02% WHEAT 655.00 ▲ 3.93% COFFEE 317.25 ▼ 5.51% SUGAR 16.43 ▼ 1.79% ORANGE JUICE 138.55 ▼ 0.47% COTTON 85.03 ▲ 2.33% COCOA 5,719 ▲ 3.18% BEEF 223.60 ▼ 3.93% CATTLE 339.10 ▼ 3.16% LITHIUM 75.20 ▲ 1.47% PETR4 41.64 ▼ 0.05% VALE3 72.97 ▲ 0.83% ITUB4 38.60 ▼ 1.03% BBDC4 16.85 ▲ 0.36% ABEV3 14.89 ▼ 0.80% BBAS3 19.37 ▲ 0.47% B3SA3 14.26 ▼ 0.21% WEGE3 47.59 ▲ 0.49% PRIO3 59.14 ▼ 0.19% SUZB3 41.33 ▲ 2.35% RENT3 34.68 ▼ 0.09% AZZA3 15.89 ▼ 2.63% CSAN3 3.22 ▼ 1.83% RAIZ4 0.25 — 0.00% PCAR3 2.75 ▼ 0.36% GMAT3 3.65 ▼ 1.08% PSSA3 48.13 ▼ 0.54% CVCB3 1.33 ▼ 2.92% POSI3 3.36 ▲ 2.44% SLCE3 13.34 ▲ 0.30% NATU3 8.14 ▼ 0.73% IBOV 185,188.13 ▼ 0.01% IPSA 11,315.26 ▼ 1.14% IPC MEX 65,473.16 ▲ 0.91% MERVAL 3,058,093 ▼ 1.55% COLCAP 2,534.46 ▲ 1.81% BVL PERÚ 59,719.97 ▲ 0.43% USD/BRL 5.16 ▲ 0.01% USD/MXN 17.06 ▼ 0.24% USD/CLP 913.98 ▲ 0.04% USD/COP 3,140 ▲ 0.03% USD/PEN 3.36 ▼ 0.66% USD/ARS 1,493 ▲ 0.10% USD/UYU 40.27 ▲ 1.24% USD/PYG 5,939 ▲ 1.68% USD/BOB 11.64 ▼ 0.76% USD/DOP 58.34 ▲ 1.25% USD/CRC 445.92 ▲ 0.89% USD/GTQ 7.62 ▲ 2.21% USD/HNL 26.79 ▲ 1.57% USD/NIO 36.62 ▲ 0.69% USD/VES 762.44 ▼ 0.13% USD/PAB 1.00 — 0.00% USD/BZD 2.00 — 0.00% USD/JMD 157.28 — 0.00% USD/TTD 6.70 ▲ 0.61% EUR/BRL 5.95 ▲ 1.01% BRENT 88.88 ▼ 0.03% WTI 83.11 ▼ 0.11% IRON ORE 161.91 — — COPPER 6.61 ▲ 0.03% GOLD 4,461 ▲ 1.78% SILVER 65.59 ▲ 1.26% SOY 1,184 ▲ 3.20% CORN 480.50 ▲ 10.02% WHEAT 655.00 ▲ 3.93% COFFEE 317.25 ▼ 5.51% SUGAR 16.43 ▼ 1.79% ORANGE JUICE 138.55 ▼ 0.47% COTTON 85.03 ▲ 2.33% COCOA 5,719 ▲ 3.18% BEEF 223.60 ▼ 3.93% CATTLE 339.10 ▼ 3.16% LITHIUM 75.20 ▲ 1.47% PETR4 41.64 ▼ 0.05% VALE3 72.97 ▲ 0.83% ITUB4 38.60 ▼ 1.03% BBDC4 16.85 ▲ 0.36% ABEV3 14.89 ▼ 0.80% BBAS3 19.37 ▲ 0.47% B3SA3 14.26 ▼ 0.21% WEGE3 47.59 ▲ 0.49% PRIO3 59.14 ▼ 0.19% SUZB3 41.33 ▲ 2.35% RENT3 34.68 ▼ 0.09% AZZA3 15.89 ▼ 2.63% CSAN3 3.22 ▼ 1.83% RAIZ4 0.25 — 0.00% PCAR3 2.75 ▼ 0.36% GMAT3 3.65 ▼ 1.08% PSSA3 48.13 ▼ 0.54% CVCB3 1.33 ▼ 2.92% POSI3 3.36 ▲ 2.44% SLCE3 13.34 ▲ 0.30% NATU3 8.14 ▼ 0.73%
since 2009
Friday, September 4, 2026

Yield Curves Reveal Diverging Realities for US and Brazil in June 2025

By · June 3, 2025 · 2 min read

Daily Brief

The morning intel from across Latin America. Free.

By subscribing you agree to our privacy policy. We never share your email.

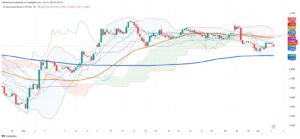
Official trading charts from June 3, 2025, show a clear divergence in government bond yields between the United States and Brazil. The US 10-year Treasury yield stands at 4.43 percent, while the 2-year yield sits at 3.92 percent.

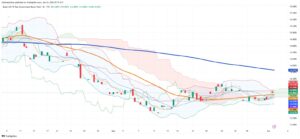
This creates a positive spread of 0.51 percentage points. In Brazil, the 10-year government bond yield registers at 14.09 percent, with the 2-year at 14.01 percent, leaving a near-flat spread of just 0.08 percentage points.

The US yield curve, with its positive slope, signals that investors expect moderate economic growth and some inflation in the coming years. The curve’s shape has shifted from an inversion seen in previous years, which often signals recession risk, to a more normalized structure. 1

This change indicates that markets now see less risk of an imminent downturn. The consistent gap between the two yields, though smaller than historical averages, suggests that investors have some confidence in the Federal Reserve’s ability to manage inflation and support growth.
2

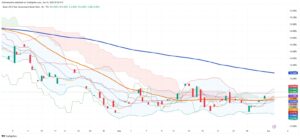
Brazil’s yield curve tells a different story. Both the 2-year and 10-year yields remain above 14 percent. The spread between them is minimal, indicating that investors see little difference in risk between short and long-term government debt.

This flatness, combined with high yields, points to persistent inflation concerns and a lack of confidence in the government’s ability to stabilize the economy. The charts show that yields have come down from recent highs, but the curve remains flat, reflecting ongoing uncertainty.
3

The gap between US and Brazilian yields is striking. Investors demand a much higher return for holding Brazilian bonds, reflecting the country’s higher inflation, fiscal uncertainty, and risk of currency depreciation. In contrast, US Treasuries remain a global benchmark for stability, even as yields remain elevated compared to the previous decade.
4
4
One-stop reference
Company Intelligence
Every listed company in Latin America — financials, ownership and structure for 1,450+ companies across 26 exchanges, in one place.
Browse the directory →
RT
Ask Rio Times
Latin American markets, currencies and companies.
Open the full Ask Rio Times →

Market participants watch these curves closely because they offer real-time insight into economic expectations. In the US, the positive curve suggests that investors expect the Federal Reserve to manage a soft landing, with no sharp shocks ahead.

In Brazil, the flat, high-yield curve underlines the challenges facing policymakers and the risks that investors see in the country’s outlook. These yield curves do not just reflect monetary policy; they also capture the broader economic mood.

The US market shows signs of cautious optimism, while Brazil’s curve signals deep concern about inflation and fiscal management. Investors will continue to watch these indicators as central banks and governments respond to changing economic conditions.

The story behind the numbers is one of diverging fortunes and risk appetites, grounded in the hard data from official trading charts.

This article was produced by The Rio Times’ automated newsroom system. How we use AI · Report an error

LatAm Markets: Live Signals → — real-time movers, turnover leaders and FX across Latin America.

Read More from The Rio Times

The Rio Times · Power Map
See who really holds power in Latin America
Click to open the Power Map

Rotate for Best Experience

This report is optimized for landscape viewing. Rotate your phone for the full experience.