Vale Lifts 2026 Iron-Ore Cost Guidance and Improves Its Base-Metals Outlook
Vale has lifted its 2026 iron-ore cost guidance while trimming expected costs for copper and nickel, a split outlook that leaves the Brazilian miner defending margins in its core business as base metals gain ground.
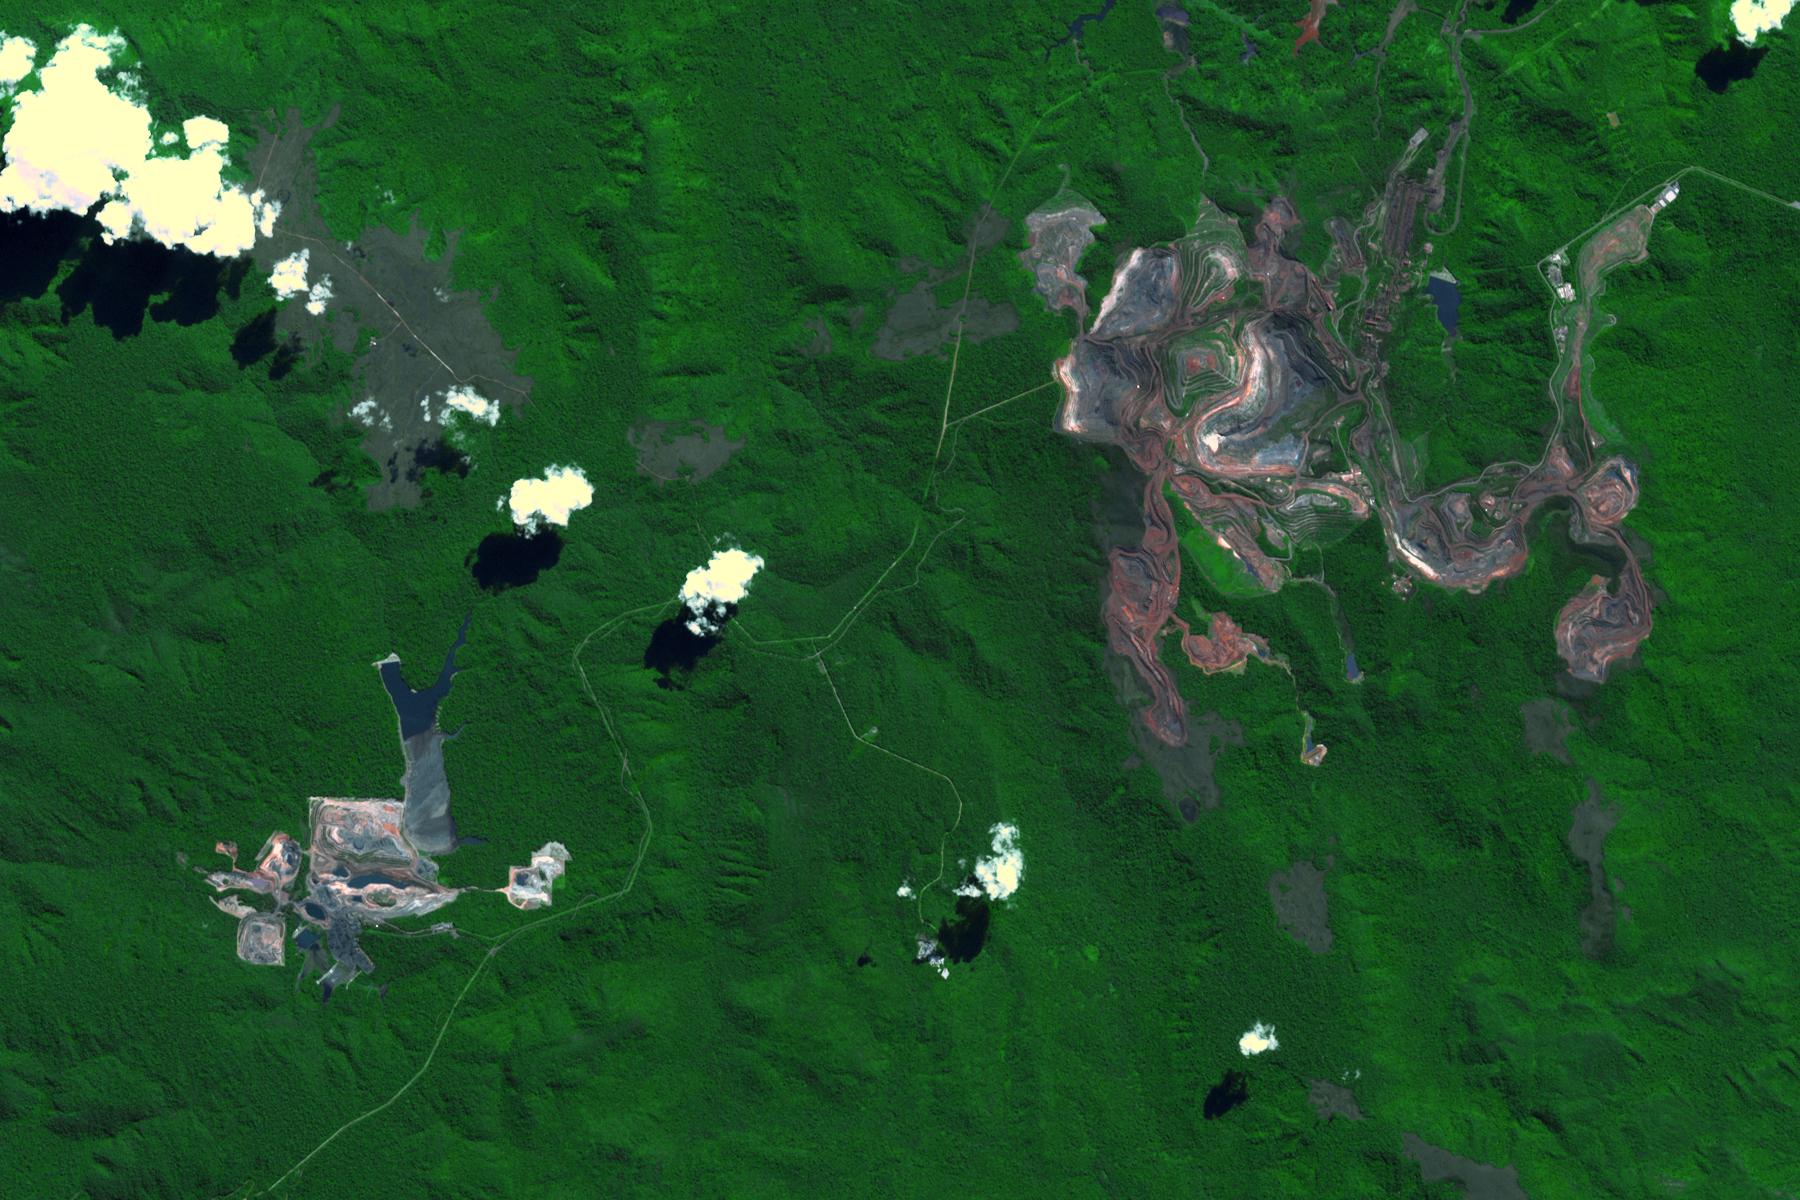
Vale Raises Its 2026 Iron-Ore Cost Guidance
Vale now expects its 2026 C1 cash cost for iron ore to fall between US$22.50 and US$23.50 per tonne, above the range of US$20 to US$21.50 per tonne it had previously guided. The company also lifted all-in iron-ore cost guidance to a band of US$58 to US$62 per tonne, from US$52 to US$56 per tonne. Both revisions apply to the full year and to the division that generates the bulk of the miner’s earnings.
The move is meaningful in scale. At the midpoint, the new C1 range sits about US$2.25 per tonne above the old one, while the all-in range shifts roughly US$6 per tonne higher. For a producer of Vale’s size, a few dollars per tonne compounds quickly across a full year of shipments. Cost guidance of this kind often carries more weight with investors than headline production figures, because it speaks directly to the margin the company can defend at any given ore price.
What C1 and All-In Costs Actually Measure
C1 is the cash cost of production measured at the mine, before freight and royalties. It captures mining, processing, on-site maintenance, labour and the fuel consumed by haul fleets and plants, which makes it the cleanest available comparison of operating discipline between producers. What it does not capture is the cost of moving ore from the pit to a customer on the other side of the world.
The all-in figure is designed to close that gap by adding the charges that sit outside C1, including freight to customers and royalties tied to each tonne sold. The distance between Vale’s two new ranges runs in the mid-to-high US$30s per tonne, an indication of how much of the delivered cost is logistics and levies rather than mining. For a Brazilian producer shipping to Asian mills, that distance is a structural feature of the business rather than a temporary condition, and it explains why the two guidance ranges did not move by the same amount.
Live Company IntelligenceVale SA ADR — the full investor dossier
Wall Street view
Valuation & profitability
Price & risk
$9.8852-wk high
$17.44
Revenue trend · 6y
Ownership
Dividend
Why the Exchange Rate and Diesel Did the Damage
Vale attributed roughly 70% of the higher C1 outlook to exchange-rate and diesel effects. The currency element is a reporting reality for a company that earns and reports in US dollars but pays most of its Brazilian mining costs in reais. When the real strengthens against the dollar, the same wage bill, the same contractor invoice and the same maintenance spend translate into more dollars per tonne, even if nothing changes in the pit.
Diesel is the second lever, and a more physical one. Open-pit mining runs on diesel-powered haul trucks, drills, loaders and support fleets, and diesel also feeds parts of the rail and port chain that carries ore to the coast. Fuel prices have been unsettled worldwide this year amid conflict-driven disruption to energy flows, and a company moving enormous volumes of rock feels that in unit costs almost immediately. Unlike a labour agreement, fuel is repriced continuously.
That leaves less than a third of the revision driven by everything else. Cost inflation in contracted services, consumables and maintenance has been a persistent theme across the mining industry in recent years, and Vale is not insulated from it. The composition matters: an increase caused mainly by currency and fuel is, in principle, reversible if those variables move the other way, whereas embedded operating inflation tends to stay.
Base Metals Move the Other Way
The base-metals side of the guidance moved in the opposite direction. Vale cut its all-in copper cost estimate to a range of US$0 to US$500 per tonne and lowered all-in nickel costs to a range of US$10,000 to US$11,500 per tonne. It also slightly increased expected 2026 production volumes for both metals. More output at a lower unit cost is the most favourable combination a mining division can report, and it lands in the part of the portfolio tied to electrification and battery demand.
The copper figure looks startling until the accounting convention behind it is understood. All-in unit costs in base metals are customarily reported net of by-product credits, so revenue from precious metals and other saleable elements produced alongside the copper is deducted from the cost line. Where those credits are large, the reported net cost of the primary metal can fall close to zero. It is a standard industry practice rather than a claim that copper is free to mine.
Record Output and a Mixed Second Quarter
The cost revision arrived with second-quarter results that were operationally strong. Iron-ore EBITDA topped US$3 billion in the quarter, while Vale Base Metals EBITDA climbed nearly 80% to US$1.3 billion. The company reported record output and higher cash flow for the period, an indication that volume discipline held even as unit costs rose.
The financial picture was less uniform. Earnings per share missed expectations, according to reports on the quarter, the kind of result that can leave a strong operating performance with a soft market reception. Record volumes, higher cash generation and an earnings shortfall can coexist when non-operating items, provisions or accounting effects sit between EBITDA and the bottom line. Taken with the guidance change, the quarter tells a two-track story: more production and more cash, against weaker unit economics in the core product.
The R$17.7 Billion Royalty Dispute
Running alongside the operating numbers is a contested royalty charge reported at R$17.7 billion (about US$3.5 billion), which Vale is challenging. The figure is a claim under dispute rather than a settled liability, and the company has not accepted it. Contingencies of that magnitude are tracked closely because they sit outside the normal rhythm of quarterly results.
Mining royalties in Brazil are levied on revenue generated from extracted minerals, and disagreements over the correct calculation base, deductions and periods covered are not unusual in the sector. Such cases typically move through administrative review before reaching the courts, and they can take years to resolve. For investors the relevant variables are size, timing and probability, none of which is fixed at this stage, and the outcome could be reduced, deferred or overturned.
What Higher Costs Mean for Margins and Dividends
Higher unit costs compress margins at any given iron-ore price, and the ore price is the one variable Vale cannot manage. With C1 guidance up and all-in guidance up by more, the breakeven point for each tonne shipped rises and the cushion between cost and realised price narrows. That arithmetic is the reason cost guidance moves shares on results day.
Shareholder returns follow free cash flow rather than headline profit, which is why the base-metals improvement matters more than its size suggests. Lower unit costs and slightly higher volumes in copper and nickel offset part of the pressure in iron ore, and the division’s EBITDA growth in the second quarter shows it is now contributing at scale. The royalty dispute is the wildcard, because an adverse resolution would compete directly with distributions for the same cash.
What Investors Will Watch Next
The first test is execution against the new ranges. Quarterly C1 prints will show whether US$22.50 to US$23.50 per tonne is a realistic full-year outcome or a floor that erodes further, and the same applies to the US$58 to US$62 all-in band. Because roughly 70% of the increase was attributed to currency and diesel, the direction of those two inputs will largely decide where in the range the year lands.
The second is whether base metals hold their improved trajectory. Delivering the slightly higher copper and nickel volumes at the reduced all-in cost ranges would suggest the division’s progress is structural rather than the product of one favourable quarter. Sustained EBITDA growth there changes the shape of the group’s earnings mix.
The third is the royalty case and what the company signals about capital allocation while it runs. Any move on provisions, any procedural milestone and any adjustment to distribution policy would be read as a view on the likely outcome. For now, Vale is asking the market to weigh record volumes and a stronger base-metals business against a costlier core and an unresolved dispute.
More: Brazil news in English, every day from The Rio Times.
Frequently Asked Questions
What is C1 cash cost and why does it matter?
C1 is the cash cost of producing a tonne of iron ore at the mine, measured before freight and royalties. It covers mining, processing, maintenance, labour and fuel, which makes it the standard yardstick for comparing operating efficiency between producers. Because it excludes shipping and levies, it is a clean but incomplete measure of what delivered ore actually costs. That is why companies also publish an all-in figure, which for Vale now stands at US$58 to US$62 per tonne for 2026.
Why did Vale raise its iron-ore cost guidance?
Vale lifted 2026 C1 guidance to US$22.50 to US$23.50 per tonne from US$20 to US$21.50, and all-in guidance to US$58 to US$62 from US$52 to US$56. Roughly 70% of the higher C1 outlook is attributable to exchange-rate and diesel effects. The currency effect arises because the company reports in US dollars while paying most Brazilian mining costs in reais. Diesel matters because open-pit mining and the rail and port chain run on it.
What changed in the copper and nickel outlook?
Vale improved its base-metals guidance, cutting the all-in copper cost estimate to a range of US$0 to US$500 per tonne and all-in nickel costs to US$10,000 to US$11,500 per tonne. It also slightly increased expected 2026 production volumes for both metals. The near-zero copper figure reflects the industry convention of reporting unit costs net of by-product credits. In the second quarter, Vale Base Metals EBITDA climbed nearly 80% to US$1.3 billion.
What is the royalty dispute Vale is contesting?
Vale is challenging a royalty charge reported at R$17.7 billion (about US$3.5 billion). The amount is a contested claim rather than a settled liability, and the company has not accepted it. Mining royalty disputes in Brazil commonly turn on the calculation base and the periods covered, and they can run for years through administrative and judicial channels. Until there is a resolution, the case functions as a contingency that investors weigh against the company’s cash generation.
Vale · Reuters · Investing.com
Sources: Vale, Reuters, Investing.com.
This article was drafted with automated assistance and reviewed before publication. How we use AI · Report an error
Read More from The Rio Times