Stone Retail Index Shows Brazil Sales Up 7% in August
BRAZIL · BUSINESS
Key Facts
- —What happened Brazilian retail sales rose 0.5% in August from July, a third straight monthly gain.
- —How big Sales were 7% higher than in August 2025, the Stone retail index reported.
- —Who led Fuel and lubricants rose 2.7% in the month, and supermarkets and food 1.6%.
- —The catch The 7% is an annual comparison, not a monthly rate, and covers Stone’s own network.
- —Who it affects Shop owners, retail investors and anyone tracking Brazilian household spending.
- —What comes next IBGE publishes its official August retail survey on 15 October 2026.
A private payments gauge recorded a third straight monthly rise, with fuel and food doing most of the work.
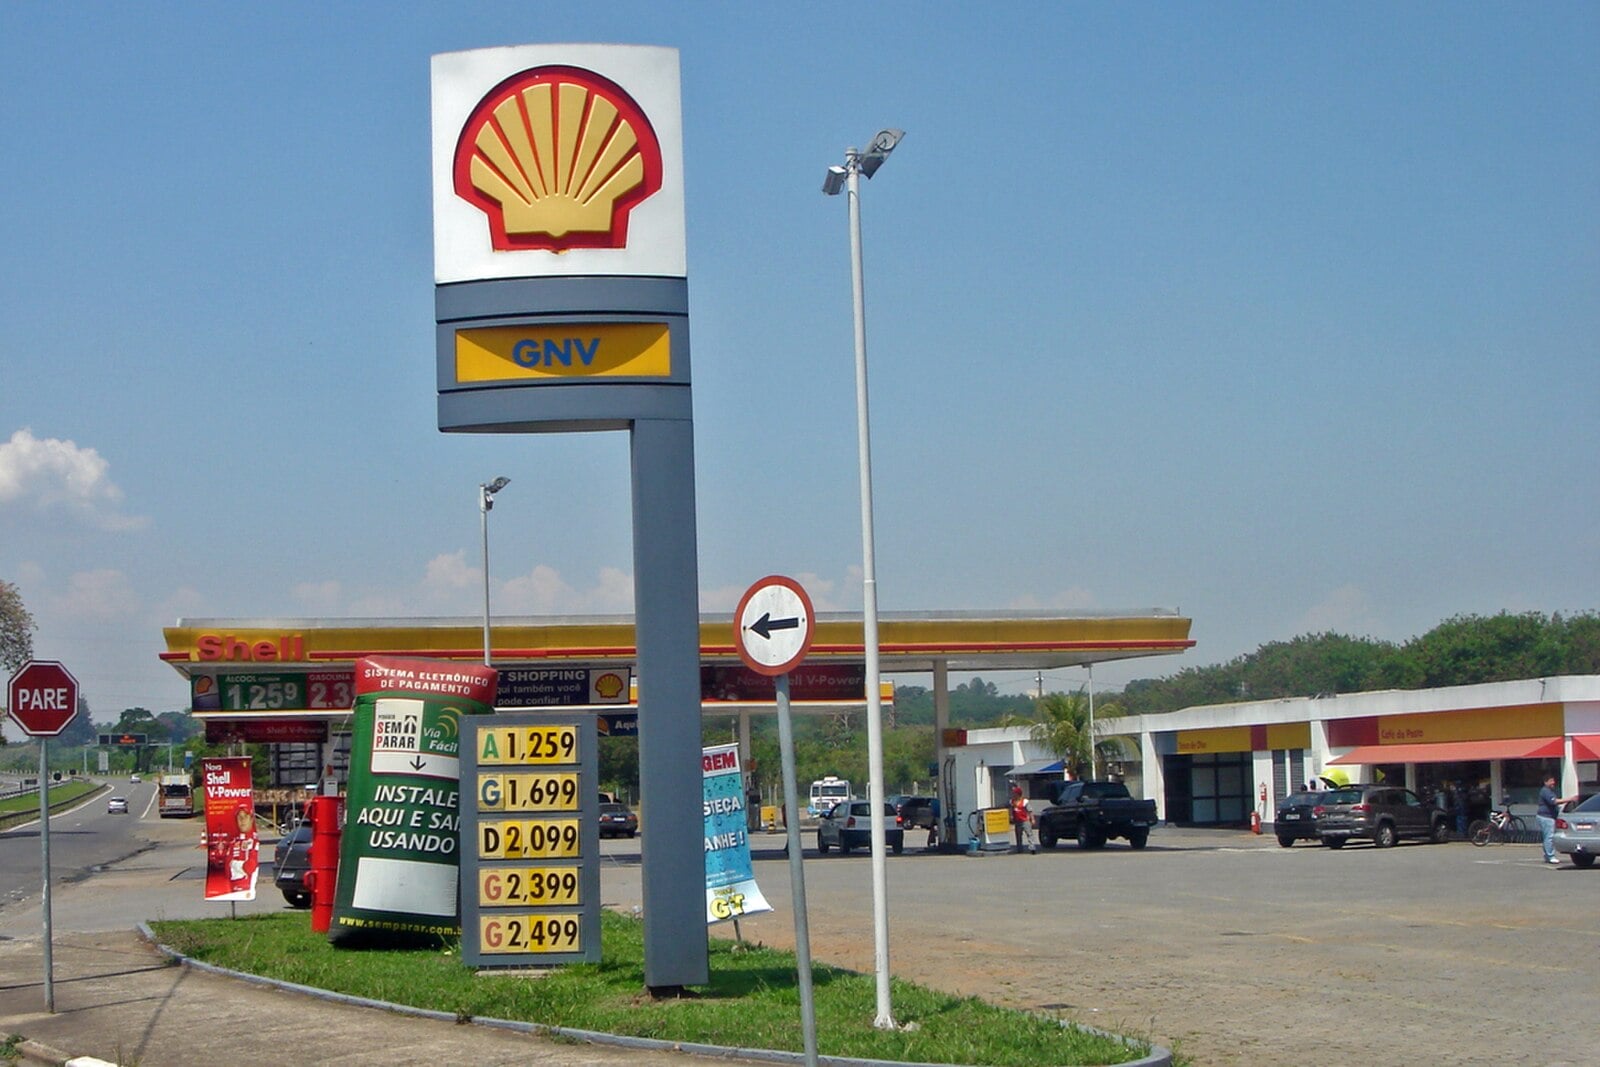
Brazil’s retail sales rose 0.5% in August from July, the third monthly gain in a row, the Stone retail index showed. Measured against August 2025, sales were 7% higher.
What the Stone retail index showed
Stone’s report gave two numbers that measure different things. Sales were 0.5% above July, and 7% above August 2025.
The gauge is called the Índice do Varejo Stone, or IVS. August was its third consecutive month of growth.
Stone is a Brazilian payments company that serves merchants across the country. It builds the index from transaction data of millions of its own customers.
That makes it a fast read on spending, published weeks before the official figures. It is a private gauge, not a government statistic.
Fuel and food led the monthly gains
The biggest monthly rise came in fuels and lubricants, up 2.7%. In Portuguese the category is Combustíveis e Lubrificantes.
Hypermarkets, supermarkets, food, drinks and tobacco rose 1.6% in the month. Stone lists that group as Hipermercados, Supermercados, Produtos Alimentícios, Bebidas e Fumo.
Five of the eight segments in the index grew during the month. The other three were lower than in July.
Both leading categories cover everyday essentials rather than big-ticket purchases. That shape of growth tells a different story from a broad spending boom.
Fuel figures reflect both pump prices and the volume sold. A gain there does not always mean shoppers bought more goods elsewhere.
The annual picture across segments
Over twelve months the spread was wider. Seven of the eight segments were above their August 2025 level, and one was below.
Fuels and lubricants led again, up 15.2% from a year earlier. The supermarket and food group rose 8.5%.
Guilherme Freitas, an economist and researcher at Stone, said the job market is still supporting incomes. He added that the impulse is weaker than in earlier quarters.
He also said high credit costs and household debt still limit demand. The effect is strongest in segments that depend on financing.
Where the gains showed up across Brazil
The index also breaks the annual result down by state. Twenty-five states were higher than a year earlier.
Amazonas led with a 21.8% annual rise. It was the strongest state reading in the August report.
Two states were lower over the year. Espírito Santo slipped 0.4% and Rio Grande do Sul fell 1.6%.
That spread points to an uneven recovery rather than one national trend. Local conditions still shape what shops actually sell.
How it compares with the official IBGE series
Brazil’s official gauge is the Pesquisa Mensal de Comércio, or PMC. It is published by IBGE, the national statistics agency.
The PMC surveys formally registered retailers with 20 or more employees. IBGE says the current sample covers 6,770 companies.
The two measures are not directly comparable. The IVS reads payment flows, while the PMC samples companies and reports sales volume.
In July the PMC showed sales down 0.8% from June. Against July 2025 it was 1.2% higher, IBGE reported on 15 September 2026.
The two series did not move together in July. Stone counted that month as a gain, while IBGE’s survey recorded the 0.8% fall.
IBGE said the drop followed a sales peak in May and June around the World Cup. Furniture and appliances led the July decline, down 4.9%.
Cristiano dos Santos, a research manager at IBGE, said July sat 1.5% below the series peak. He said the peak remained very close.
Different samples explain much of the gap. Stone sees only its own merchants, while IBGE weights a national sample of larger retailers.
Why the Stone retail index matters to expats and investors
The Stone retail index is a direct read on how households are spending. It lands while the official picture for the same month is still weeks away.
For investors in Brazilian retailers or payment firms, the segment mix matters as much as the headline. Fuel and food strength helps some businesses more than others.
For expats living on reais, the numbers hint at where demand may be heading. They are context for budgeting, not a forecast.
A gauge built on card and digital payments can also miss cash sales. That is one reason to read it beside the official survey.
The index is one signal among several. Official sales and inflation data are still needed to complete the picture.
What is not yet known
Stone’s public page does not say whether the 7% is adjusted for inflation. That gap makes a direct comparison with IBGE’s volume figures unsafe.
The full method behind the index is not set out on that public page either. The detailed segment table sits in Stone’s own report and dataset.
IBGE publishes its August retail survey on 15 October 2026. That release will show whether the official series points the same way as the Stone retail index.
September’s reading will show whether the run of monthly gains reaches four.
Frequently Asked Questions
Frequently Asked Questions
What is the Stone retail index?
It is the Índice do Varejo Stone, a private gauge of Brazilian retail sales. Stone builds it from transaction data of millions of its own customers.
How much did Brazilian retail sales rise in August 2026?
Sales were 0.5% above July and 7% above August 2025, according to Stone. It was the third monthly gain in a row.
Which segments and states led the gains?
Fuels and lubricants rose 2.7% in the month and 15.2% over the year. Amazonas led the states with a 21.8% annual rise.
Connected Coverage
Brazil Sets an August Tax Record as Company and Capital Levies Rise
Brazil’s Central Bank Says Inflation Is Still Driven by Demand
Sources: Índice do Varejo Stone, August 2026 report; Reuters, via InfoMoney, CNN Brasil and Investing.com Brasil; IBGE Pesquisa Mensal de Comércio.
This article was produced by The Rio Times’ automated newsroom system. How we use AI · Report an error
Read More from The Rio Times