IBOV 188,268.59 ▲ 1.42% IPSA 11,238.63 ▼ 1.16% IPC MEX 64,499.43 ▼ 0.49% MERVAL 3,157,852 ▲ 1.53% COLCAP 2,626.71 ▲ 1.65% BVL PERÚ 60,702.89 ▼ 2.19% USD/BRL5.09▼ 0.27% USD/MXN16.98▲ 0.48% USD/CLP940.47▲ 1.38% USD/COP3,088▼ 0.94% USD/PEN3.36▲ 0.07% USD/ARS1,513▼ 0.08% USD/UYU40.24▲ 3.05% USD/PYG5,868▲ 2.26% USD/BOB12.36▲ 1.91% USD/DOP58.63▲ 0.22% USD/CRC447.58▲ 1.69% USD/GTQ7.63▲ 3.04% USD/HNL26.85▲ 0.57% USD/NIO36.62▲ 0.34% USD/VES830.41▲ 0.45% USD/PAB1.00— 0.00% USD/BZD2.00— 0.00% USD/JMD 157.28 — 0.00% USD/TTD6.73▲ 2.40% EUR/BRL5.92▲ 0.26% BRENT 88.88 ▼ 0.03% WTI 83.11 ▼ 0.11% IRON ORE 161.91 — — COPPER 6.61 ▲ 0.03% GOLD 4,461 ▲ 1.78% SILVER 65.59 ▲ 1.26% SOY 1,184 ▲ 3.20% CORN 480.50 ▲ 10.02% WHEAT 655.00 ▲ 3.93% COFFEE 317.25 ▼ 5.51% SUGAR 16.43 ▼ 1.79% ORANGE JUICE 138.55 ▼ 0.47% COTTON 85.03 ▲ 2.33% COCOA 5,719 ▲ 3.18% BEEF 223.60 ▼ 3.93% CATTLE 339.10 ▼ 3.16% LITHIUM 75.20 ▲ 1.47% PETR4 41.64 ▼ 0.05% VALE3 72.97 ▲ 0.83% ITUB4 38.60 ▼ 1.03% BBDC4 16.85 ▲ 0.36% ABEV3 14.89 ▼ 0.80% BBAS3 19.37 ▲ 0.47% B3SA3 14.26 ▼ 0.21% WEGE3 47.59 ▲ 0.49% PRIO3 59.14 ▼ 0.19% SUZB3 41.33 ▲ 2.35% RENT3 34.68 ▼ 0.09% AZZA3 15.89 ▼ 2.63% CSAN3 3.22 ▼ 1.83% RAIZ4 0.25 — 0.00% PCAR3 2.75 ▼ 0.36% GMAT3 3.65 ▼ 1.08% PSSA3 48.13 ▼ 0.54% CVCB3 1.33 ▼ 2.92% POSI3 3.36 ▲ 2.44% SLCE3 13.34 ▲ 0.30% NATU3 8.14 ▼ 0.73% IBOV 188,268.59 ▲ 1.42% IPSA 11,238.63 ▼ 1.16% IPC MEX 64,499.43 ▼ 0.49% MERVAL 3,157,852 ▲ 1.53% COLCAP 2,626.71 ▲ 1.65% BVL PERÚ 60,702.89 ▼ 2.19% USD/BRL 5.16 ▲ 0.01% USD/MXN 17.06 ▼ 0.24% USD/CLP 913.98 ▲ 0.04% USD/COP 3,140 ▲ 0.03% USD/PEN 3.36 ▼ 0.66% USD/ARS 1,493 ▲ 0.10% USD/UYU 40.27 ▲ 1.24% USD/PYG 5,939 ▲ 1.68% USD/BOB 11.64 ▼ 0.76% USD/DOP 58.34 ▲ 1.25% USD/CRC 445.92 ▲ 0.89% USD/GTQ 7.62 ▲ 2.21% USD/HNL 26.79 ▲ 1.57% USD/NIO 36.62 ▲ 0.69% USD/VES 762.44 ▼ 0.13% USD/PAB 1.00 — 0.00% USD/BZD 2.00 — 0.00% USD/JMD 157.28 — 0.00% USD/TTD 6.70 ▲ 0.61% EUR/BRL 5.95 ▲ 1.01% BRENT 88.88 ▼ 0.03% WTI 83.11 ▼ 0.11% IRON ORE 161.91 — — COPPER 6.61 ▲ 0.03% GOLD 4,461 ▲ 1.78% SILVER 65.59 ▲ 1.26% SOY 1,184 ▲ 3.20% CORN 480.50 ▲ 10.02% WHEAT 655.00 ▲ 3.93% COFFEE 317.25 ▼ 5.51% SUGAR 16.43 ▼ 1.79% ORANGE JUICE 138.55 ▼ 0.47% COTTON 85.03 ▲ 2.33% COCOA 5,719 ▲ 3.18% BEEF 223.60 ▼ 3.93% CATTLE 339.10 ▼ 3.16% LITHIUM 75.20 ▲ 1.47% PETR4 41.64 ▼ 0.05% VALE3 72.97 ▲ 0.83% ITUB4 38.60 ▼ 1.03% BBDC4 16.85 ▲ 0.36% ABEV3 14.89 ▼ 0.80% BBAS3 19.37 ▲ 0.47% B3SA3 14.26 ▼ 0.21% WEGE3 47.59 ▲ 0.49% PRIO3 59.14 ▼ 0.19% SUZB3 41.33 ▲ 2.35% RENT3 34.68 ▼ 0.09% AZZA3 15.89 ▼ 2.63% CSAN3 3.22 ▼ 1.83% RAIZ4 0.25 — 0.00% PCAR3 2.75 ▼ 0.36% GMAT3 3.65 ▼ 1.08% PSSA3 48.13 ▼ 0.54% CVCB3 1.33 ▼ 2.92% POSI3 3.36 ▲ 2.44% SLCE3 13.34 ▲ 0.30% NATU3 8.14 ▼ 0.73%
since 2009
Friday, September 11, 2026

China Africa

Shifting Foundations: Chinese Cement Giants Pivot to Africa Amid Domestic Decline

By · August 20, 2024 · 2 min read

Africa Intelligence

One email, every weekday morning. African markets, politics and business — filed from our newsroom in Rio.

Yesterday’s subject line: “Nigeria's Dangote signs for Africa's biggest IPO ever”

Free. We send a confirmation link first — nothing arrives until you click it. Unsubscribe with one click in any edition. If you stop opening us for 30 days we stop sending by ourselves, as we assume the interest is no longer there. See our privacy policy. We never share your email.

As China’s domestic cement market shrinks due to a prolonged property downturn, its major cement manufacturers are strategically expanding into Africa’s burgeoning infrastructure sector.

This pivot is crucial not just for maintaining profitability but also for tapping into emerging markets that promise higher returns and less competition. In 2023, the contrast in market dynamics between China and Africa was stark.

Chinese operations struggled with low selling prices, at just 292 yuan ($41) per tonne. In contrast, African ventures saw prices soar to 813 yuan ($113) per tonne.

The profit margins followed a similar trend, with gross profits per ton being significantly higher in Africa. They ranged from 358 yuan in Mozambique to 509 yuan in the DRC and 504 yuan in Ethiopia, compared to just 44 yuan in China.

The strategic realignment toward Africa is backed by substantial investments. For instance, West China Cement is spearheading a $600 million project in Ethiopia.
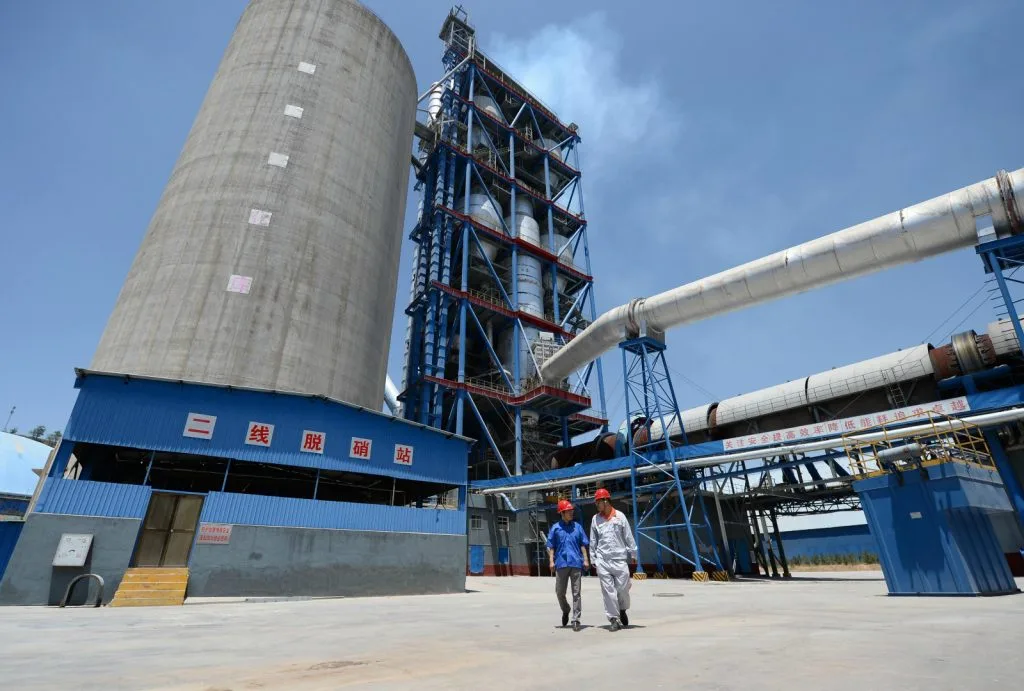
Shifting Foundations: Chinese Cement Giants Pivot to Africa Amid Domestic Decline
Shifting Foundations: Chinese Cement Giants Pivot to Africa Amid Domestic Decline.
One-stop reference
Company Intelligence
Every listed company in Latin America — financials, ownership and structure for 1,450+ companies across 26 exchanges, in one place.
Browse the directory →
RT
Ask Rio Times
17 years of Latin America reporting, on demand.
Open the full Ask Rio Times →

Chinese Investment in Africa:

This project aims to establish the country’s largest cement factory, with an annual capacity of 4.5 million metric tons.

This move is part of a broader pattern where Chinese companies are not just investing in manufacturing. They are also actively participating in and benefiting from the infrastructure boom across Africa—ranging from roads and railways to energy projects.

This shift serves a dual purpose. It offers Chinese companies relief from the saturated and low-margin domestic market. Additionally, it secures a long-term investment horizon in a region with rising demand and economic growth.

This strategic migration illustrates how businesses can adapt to global economic trends, ensuring growth and sustainability even in challenging conditions.

By focusing on high-growth regions like Africa, these companies are not just surviving. They’re positioning themselves at the forefront of a global shift and setting a template for others in similar industries to follow.

In short, this move underscores the importance of agility and foresight in today’s interconnected economic landscape.

This article was produced by The Rio Times’ automated newsroom system. How we use AI · Report an error

Part of our ongoing coverage

Africa: The New Scramble — the great-power contest over the continent.

Read More from The Rio Times

The Rio Times · Power Map
See who really holds power in Latin America
Click to open the Power Map

Rotate for Best Experience

This report is optimized for landscape viewing. Rotate your phone for the full experience.