Rental Price Growth Slows in Brazil, but Still Up 11% Over the Year
Residential rental prices in Brazil continued to rise in June 2025, although at a slower monthly rate. According to the FipeZAP Index, which tracks rental trends in 36 key Brazilian cities, the average rent increased by 0.51% in June.
This marked a further deceleration compared to April’s rise of 1.15% and May’s 0.59%, signaling some cooling pressure after months of sharper increases.
Despite the monthly slowdown, rents have risen sharply over the last year. In the 12-month period ending in June, residential rents increased an average of 11.02% across Brazil.
This rise was more than double the official inflation rate, measured by the IPCA index produced by IBGE, which stood at 5.35% in the same period. This means the cost of renting a home has gone up much faster than the general cost of living.
Some cities recorded much steeper rent hikes. Salvador posted the most extreme increase, with average rents jumping 22.68% over 12 months. Belém followed with a 19.85% rise, and Porto Alegre with 18.75%.
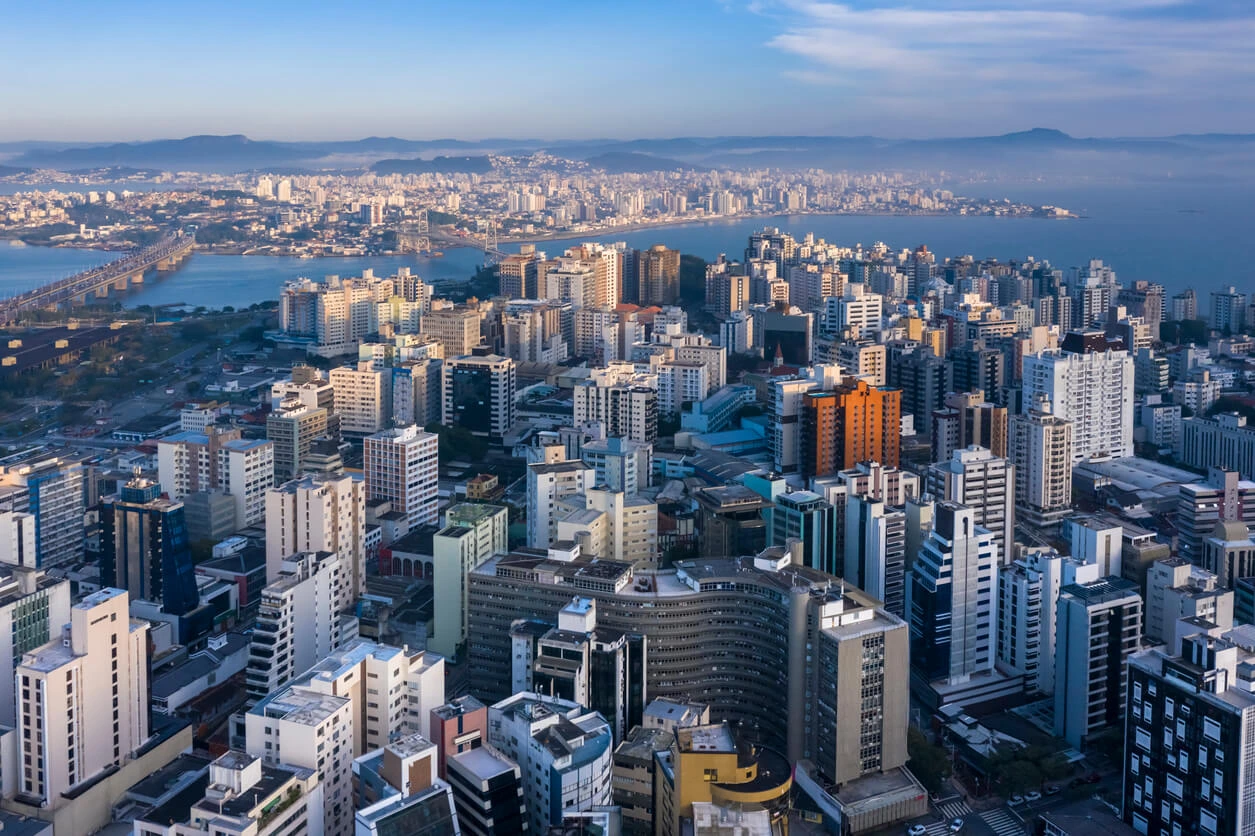
Other cities like Fortaleza, Cuiabá, and Manaus also saw double-digit increases, showing a nationwide trend regardless of region. São Paulo, the largest housing market in the country, saw an annual rent gain of 10.81%, while Rio de Janeiro rose by 9.66%.
The size and type of properties also affected pricing pressure. One-bedroom apartments experienced the highest average increase during this period, with rents rising 11.91%. In comparison, three-bedroom units rose slightly less, at 10.70%.
Smaller units continue to feel stronger upward pressure, likely driven by increased demand from young professionals and smaller households, especially in more central areas with limited supply.
However, not all cities followed the same path. While most regions saw consistent increases, a few recorded either stagnant or even falling rents. Aracaju had a marginal rise of just 0.28%, and Brasília was the only capital with a year-on-year rent decline, falling by 1.54%.
This divergence in rent trends reflects differences in local demand, employment opportunities, and urban migration patterns. Cities with stronger economies or where housing construction has lagged are seeing sharper pricing pressure, widening the affordability gap for renters.
Although the overall trend for 2025 points to a cooling in the pace of monthly increases, the high annual growth still puts pressure on household budgets. Rents continue to outpace inflation, signaling ongoing tension between housing demand and supply.
The data confirms that, while the increase in rents is slowing, the overall level remains elevated compared to broader cost-of-living benchmarks.
This matters not only for families renting homes but also for public policy focused on housing supply, affordability, and mobility across Brazil’s urban centers.
These findings are based on official data from the FipeZAP Index and IPCA/IBGE inflation reports.
| City / Index | 12-Month Change |
|---|---|
| Salvador (BA) | +22.68% |
| Belém (PA) | +19.85% |
| Porto Alegre (RS) | +18.75% |
| Fortaleza (CE) | +16.84% |
| Cuiabá (MT) | +15.77% |
| Manaus (AM) | +14.57% |
| Belo Horizonte (MG) | +13.51% |
| Recife (PE) | +13.29% |
| Teresina (PI) | +13.15% |
| João Pessoa (PB) | +12.12% |
| Natal (RN) | +11.09% |
| FipeZAP Index | +11.02% |
| Campo Grande (MS) | +10.85% |
| São Paulo (SP) | +10.81% |
| São Luís (MA) | +10.27% |
| Curitiba (PR) | +10.03% |
| Maceió (AL) | +9.92% |
| Rio de Janeiro (RJ) | +9.66% |
| Goiânia (GO) | +9.65% |
| Vitória (ES) | +9.31% |
| Florianópolis (SC) | +9.18% |
| IPCA (IBGE) | +5.35% |
| Aracaju (SE) | +0.28% |
| Brasília (DF) | -1.54% |
More: Brazil news in English, every day from The Rio Times.
Live Market IntelligenceBrazil — Live Market Board
Rio Times · Live Market Intelligence
Brazil — Live Market Board
+2.63%
192,114.55
+2.63%
64,531.68
+1.10%
10,916.57
+0.08%
2,767,663
+0.32%
2,515.02
-0.59%
59,751.67
+0.18%
| Instrument | Last | Change | YoY | Prev. | High | Low | Volume |
|---|---|---|---|---|---|---|---|
| IBOV | 192,114.55 | +2.63% | +21.85% | 187,197.46 | 168,310 | 167,142 | — |
| USD/BRL | 5.16 | +0.01% | -5.13% | 5.16 | 5.18 | 5.14 | — |
| SELIC | 14.00% | — | — | — | — | — | |
| PETR4 | 41.64 | -0.05% | +35.19% | 41.66 | 41.97 | 41.15 | 41,499,400 |
| VALE3 | 72.97 | +0.83% | +30.75% | 72.37 | 73.54 | 72.66 | 17,658,000 |
| ITUB4 | 38.60 | -1.03% | +4.57% | 39.00 | 39.34 | 38.39 | 29,487,800 |
| BBDC4 | 16.85 | +0.36% | +3.50% | 16.79 | 16.90 | 16.67 | 19,416,900 |
| BBAS3 | 19.37 | +0.47% | +0.73% | 19.28 | 19.44 | 19.16 | 11,069,200 |
| B3SA3 | 14.26 | -0.21% | +12.73% | 14.29 | 14.47 | 14.11 | 33,037,800 |
| ABEV3 | 14.89 | -0.80% | +21.91% | 15.01 | 15.07 | 14.81 | 16,453,100 |
| WEGE3 | 47.59 | +0.49% | +29.99% | 47.36 | 48.08 | 47.36 | 3,364,600 |
| PRIO3 | 59.14 | -0.19% | +50.67% | 59.25 | 59.81 | 58.74 | 3,325,600 |
| SUZB3 | 41.33 | +2.35% | -23.55% | 40.38 | 41.48 | 40.35 | 3,914,900 |
| RENT3 | 34.68 | -0.09% | +0.84% | 34.71 | 34.96 | 34.35 | 7,979,100 |
| AZZA3 | 15.89 | -2.63% | -53.76% | 16.32 | 16.42 | 15.82 | 1,330,300 |
| CSNA3 | 4.30 | +0.47% | -42.65% | 4.28 | 4.41 | 4.26 | 10,076,100 |
| GGBR4 | 24.69 | +2.19% | +51.38% | 24.16 | 24.85 | 24.18 | 7,047,600 |
| ENEV3 | 24.21 | -1.38% | +70.49% | 24.55 | 24.64 | 23.99 | 9,297,000 |
This article was produced by The Rio Times’ automated newsroom system. How we use AI · Report an error · Editorial responsibility: Matthias Camenzind, Editor-in-Chief