
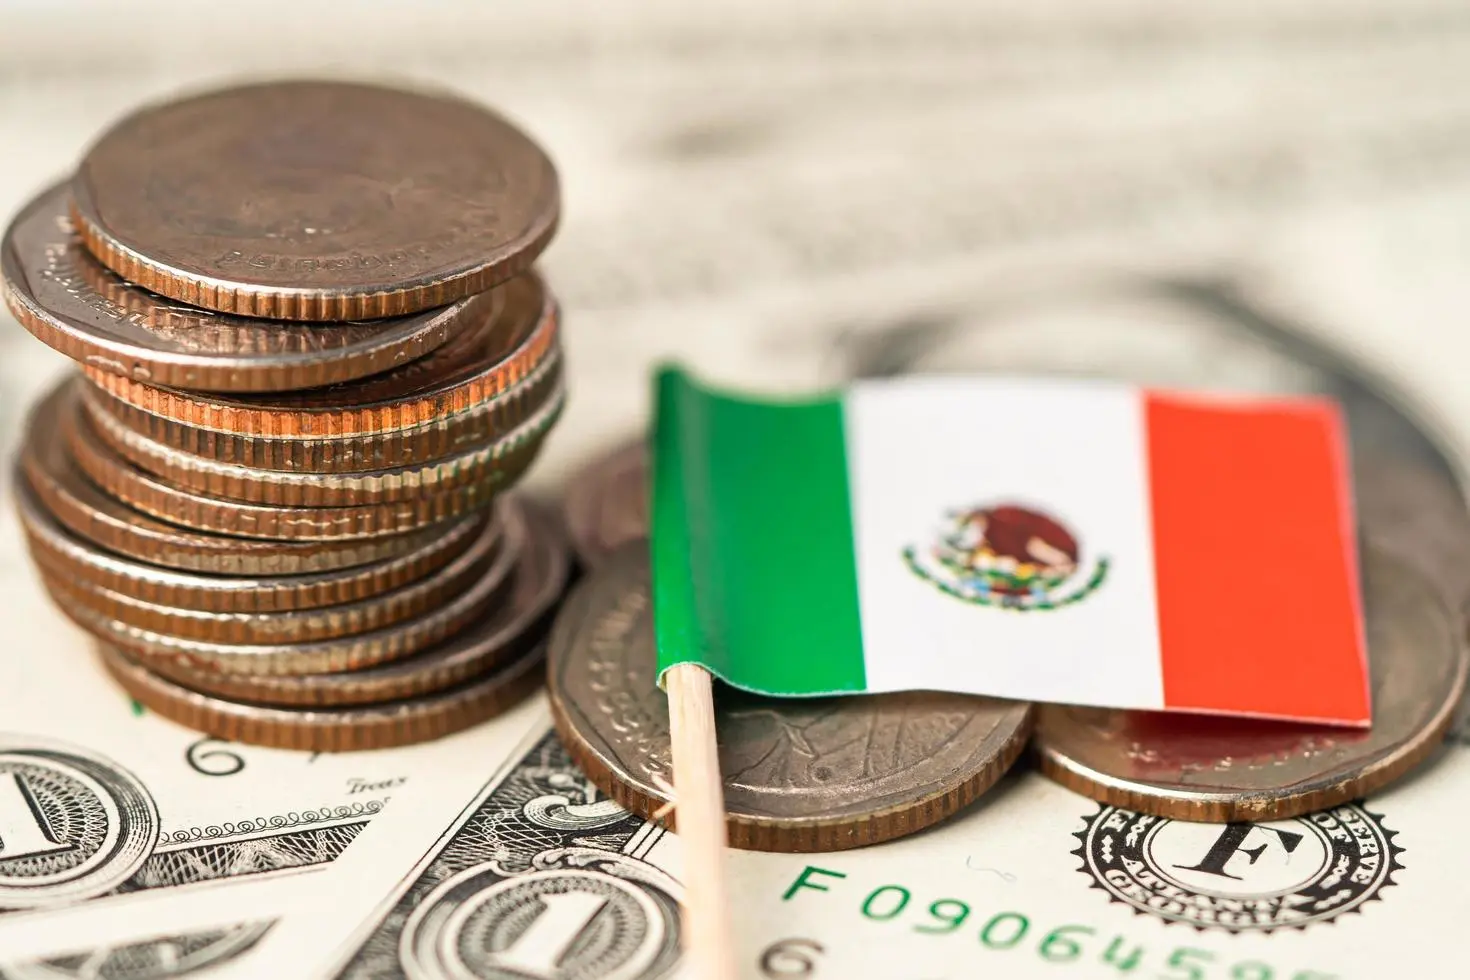
For years, the question about Mexico and nearshoring has been the same: when will the announcements turn into actual investment? The 2025 numbers suggest the answer is now. Mexico’s Economy Ministry reported that foreign direct investment reached a record $40.9 billion last year, up 10.8% from 2024 and the highest annual figure since tracking began — all while global FDI flows to developing economies fell 2%, according to the United Nations.
This is part of The Rio Times’ daily coverage of Mexico news and Latin American financial news.
Fresh Capital, Not Just Reinvested Profits
The headline number matters, but the composition matters more. Reinvested profits — money that foreign companies already operating in Mexico chose not to repatriate — still accounted for 67.7% of the total, or $27.7 billion, though that figure actually fell 3.7% as companies distributed more dividends. The real story is the surge in new investments: fresh capital from foreign firms setting up operations in Mexico for the first time or expanding existing ones. That category jumped 133% to $7.4 billion, the fastest-growing component by far. Intercompany transfers rose 17% to $5.8 billion.
The explosion in new investment is what nearshoring optimists have been waiting for. It suggests that the wave of announcements from manufacturers relocating supply chains closer to the US market — driven by the USMCA trade agreement and tariff uncertainty with China — is now producing concrete commitments. At least 20 new foreign companies established operations in Mexico during 2025, absorbing more than two million square feet of industrial space across corridors in Monterrey, Querétaro, Guanajuato and Tijuana.
Where the Money Comes From
The United States remained Mexico’s dominant investment partner, accounting for $15.9 billion or 38.8% of the total. Spain came second with $4.4 billion (10.8%), followed by Canada at $3.3 billion (8.1%), the Netherlands at $2.4 billion (5.8%) and Japan at $2.3 billion (5.6%). Together, North American partners — the US and Canada — provided nearly half of all investment. Manufacturing absorbed 37.1% of total FDI, with transport equipment, aerospace and electronics leading the inflows. Financial services accounted for 25.1%, boosted partly by data center investments, while construction rebounded to 5% after negative figures in 2024.
The performance is striking in global context. UNCTAD’s January 2026 estimates show global FDI rose 14% to $1.6 trillion last year, but the gains were concentrated in developed economies and financial hubs. Flows to developing countries fell 2%, and three-quarters of least developed countries saw stagnant or declining investment. Mexico’s record stands as a rare bright spot in an otherwise fragile landscape.
Mexico City Takes the Lion’s Share
Geographically, the capital dominated, receiving $22.4 billion — 54.8% of all FDI and a 55.1% jump from the prior year. Nuevo León, the northern industrial powerhouse anchored by Monterrey, came second with $3.6 billion after a 72.9% surge. The State of Mexico placed third at $3.3 billion. Together, the top five states captured 80.2% of the national total, underscoring the extreme concentration of foreign capital in a handful of urban-industrial corridors.
The Fine Print
Not everything in the data is rosy. The fourth quarter registered a negative flow of $5 billion, driven by dividend payments and intercompany financial operations — not cancellations, but a reminder that FDI figures can swing sharply on corporate treasury decisions. The record was secured by strong inflows in the first three quarters, which more than compensated. Still, for a government that has staked its “Plan México” strategy on becoming the world’s 10th-largest economy by 2030, the challenge now shifts from attracting capital to converting it into the jobs, productivity gains and industrial depth that nearshoring was always supposed to deliver.
For more context, read Brazil’s Morning Call and the Ibovespa market report.
Key Facts
— Deep Dive
— For the complete picture, read our in-depth guide: Mexico Economy 2026: GDP, Peso, Nearshoring, Banxico and Trade
This article was produced by The Rio Times’ automated newsroom system. How we use AI · Report an error · Editorial responsibility: Matthias Camenzind, Editor-in-Chief
In depth
Read More from The Rio Times