Market Moves: Analyzing Bitcoin and Ethereum’s Price Trends in February 2025
The cryptocurrency market, including Bitcoin (BTC) and Ethereum (ETH), experienced notable volatility on February 7, 2025. Prices fluctuated throughout the day and into the night, reflecting a dynamic interplay of market forces.
Bitcoin (BTC) Analysis
Price and Volume
Bitcoin started the day trading around $98,600 went up to $100,100 but faced selling pressure, pushing the price down to approximately $96,070 by the end of the day. Trading volume exceeded $48 billion, indicating strong market activity and investor interest.
ETF Inflows and Outflows
Institutional activity significantly influenced recent price movements. Bitcoin ETFs saw substantial inflows, suggesting that institutional investors are increasingly viewing Bitcoin as a viable investment option.
Analysts like Tom Lee of Fundstrat predict Bitcoin could reach $250,000 by the end of 2025, driven by continued institutional adoption and the impact of Bitcoin ETFs.

Technical Analysis
- Moving Averages: The 50-day moving average is acting as resistance, while the 200-day moving average provides support. The price is below the 9-day and 20-day moving averages, indicating short-term bearish momentum.
- Support and Resistance Levels: Immediate support for Bitcoin is around $95,000, with a stronger support level at $80,000. Resistance is near $100,000. A break above this resistance could indicate a bullish reversal, while a drop below the support levels may lead to further downside movement.
- RSI: The Relative Strength Index (RSI) for BTC is currently at a level that suggests it is neither overbought nor oversold, indicating potential consolidation. However, if the RSI moves below 30, it could signal a buying opportunity, while a move above 70 might indicate a need for caution due to overbought conditions.
Ethereum (ETH) and Altcoins Analysis
Price and Volume
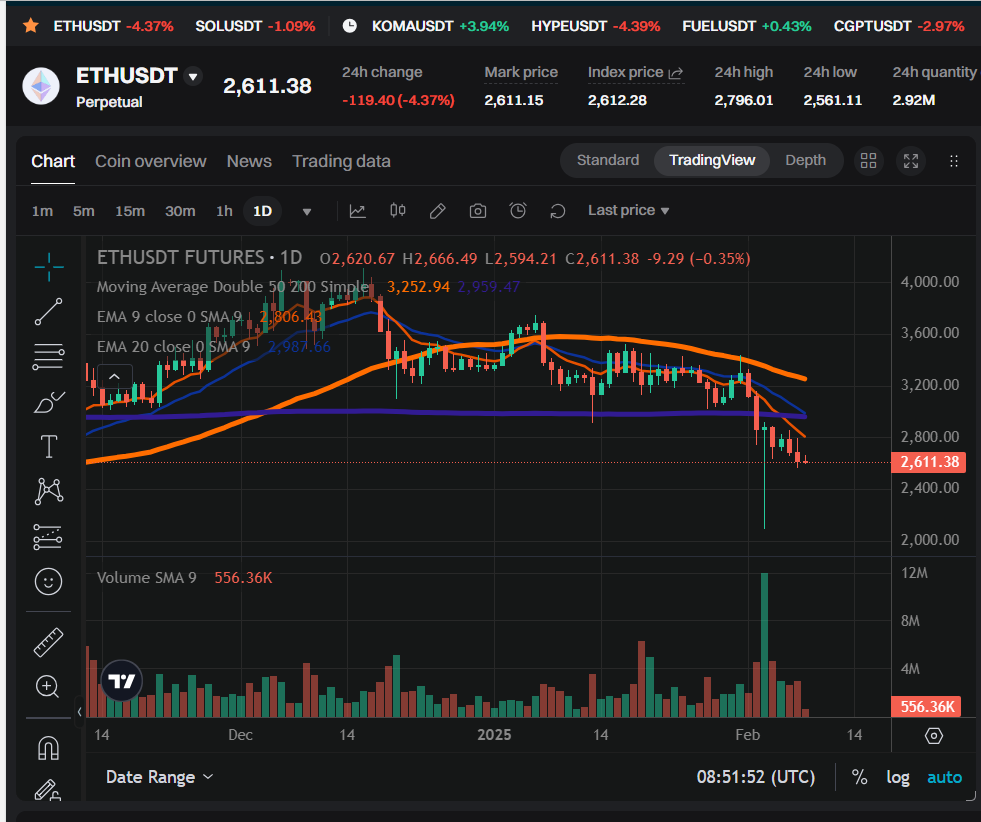
Ethereum (ETH) experienced significant price volatility on February 7, 2025, with sharp fluctuations throughout the day. The price initially opened lower, reflecting bearish sentiment, but saw brief periods of recovery to $2,797 as traders attempted to push it higher.
However, selling pressure dominated, leading to a decline in the latter part of the day. The trading volume was elevated, indicating strong market participation and interest. By the end of the day, ETH closed below key moving averages, suggesting short-term bearish momentum.
Technical Analysis
- Moving Averages: For ETH, the 50-day moving average is also acting as resistance, while the 200-day moving average provides support. The price is below the 9-day and 20-day moving averages, indicating short-term bearish momentum.
- Support and Resistance Levels: Key support levels for ETH are around $2,500, with resistance near $2,800. A break above resistance could signal a bullish reversal, while a drop below support might lead to further downside.
- Ethereum’s price has recently broken through its 200-day moving average, indicating a weaker technical position compared to Bitcoin.
- Unlike BTC, where the 200-day moving average remains well below the price, ETH’s breach of this key support level suggests heightened vulnerability.
- This development signals that ETH may face a more pronounced downfall, making it more susceptible to further declines compared to Bitcoin.
- RSI: The RSI for ETH is also in a neutral zone, suggesting possible consolidation. An RSI below 30 would indicate oversold conditions and potential buying opportunities, while an RSI above 70 would suggest overbought conditions and potential selling pressure.
Expert Opinions
Market makers and analysts have highlighted the significance of institutional adoption in driving the prices of both BTC and ETH higher. The role of ETFs and regulatory developments are seen as crucial factors influencing market sentiment and price movements.
Conclusion
The recent price movements in the cryptocurrency market highlight a complex interaction of technical indicators, institutional involvement, and market sentiment. While both Bitcoin (BTC) and Ethereum (ETH) exhibit solid short-term bearish signals, the long-term outlook for BTC remains positive.
In contrast, ETH’s position appears significantly weaker, particularly after breaking through its 200-day moving average. Investors should closely monitor key support levels and stay updated on institutional activities and regulatory changes to effectively navigate the volatile cryptocurrency landscape.
Live Market IntelligenceCrypto — Live Market Board
Rio Times · Live Market Intelligence
Crypto — Live Market Board
-0.26%
| Instrument | Last | Change | YoY | Prev. | High | Low | Volume |
|---|---|---|---|---|---|---|---|
| BTC | 63,384 | -0.26% | -47.24% | 63,552 | 64,346 | 63,305 | 22,774,743,040 |
| ETH | 1,886 | +0.26% | -58.90% | 1,881 | 1,920 | 1,879 | 7,916,475,392 |
| SOL | 75.89 | -0.40% | -60.44% | 76.20 | 76.99 | 75.39 | 1,473,821,056 |
| XRP | 1.01 | -1.15% | -69.07% | 1.02 | 1.02 | 1.01 | 1,144,044,416 |
| BNB | 609.60 | -1.12% | -26.81% | 616.50 | 619.30 | 609.23 | 1,266,706,432 |
| ADA | 0.18 | -1.98% | -78.22% | 0.19 | 0.19 | 0.18 | 238,085,632 |
| DOGE | 0.07 | -1.56% | -70.00% | 0.07 | 0.07 | 0.07 | 553,256,192 |
| AVAX | 6.38 | +1.04% | -74.11% | 6.32 | 6.42 | 6.21 | 248,470,560 |
| LINK | 8.77 | -0.06% | -62.73% | 8.77 | 8.87 | 8.68 | 317,054,880 |
| DOT | 0.78 | -0.75% | -81.11% | 0.79 | 0.80 | 0.78 | 43,490,492 |
| LTC | 45.08 | -0.85% | -65.45% | 45.47 | 45.59 | 44.98 | 143,727,712 |
| BCH | 213.85 | +0.10% | -65.44% | 213.64 | 215.69 | 212.54 | 137,956,688 |
| TRX | 0.34 | +0.28% | -4.73% | 0.33 | 0.34 | 0.33 | 436,576,064 |
| XLM | 0.16 | -1.33% | -64.46% | 0.16 | 0.16 | 0.16 | 89,559,864 |
| HBAR | 0.07 | -0.53% | -74.67% | 0.07 | 0.07 | 0.07 | 22,546,186 |
| NEAR | 1.65 | +2.42% | -40.55% | 1.62 | 1.68 | 1.61 | 187,591,264 |
| ATOM | 1.40 | -2.36% | -70.15% | 1.44 | 1.44 | 1.40 | 18,626,964 |
| AAVE | 89.06 | +0.93% | -72.33% | 88.24 | 90.20 | 88.19 | 129,099,704 |
This article was produced by The Rio Times’ automated newsroom system. How we use AI · Report an error · Editorial responsibility: Matthias Camenzind, Editor-in-Chief
LatAm Markets: Live Signals → — real-time movers, turnover leaders and FX across Latin America.