Lithium Wrap Sept 4: Albemarle SQM Slide; LIT Dip
Key Facts
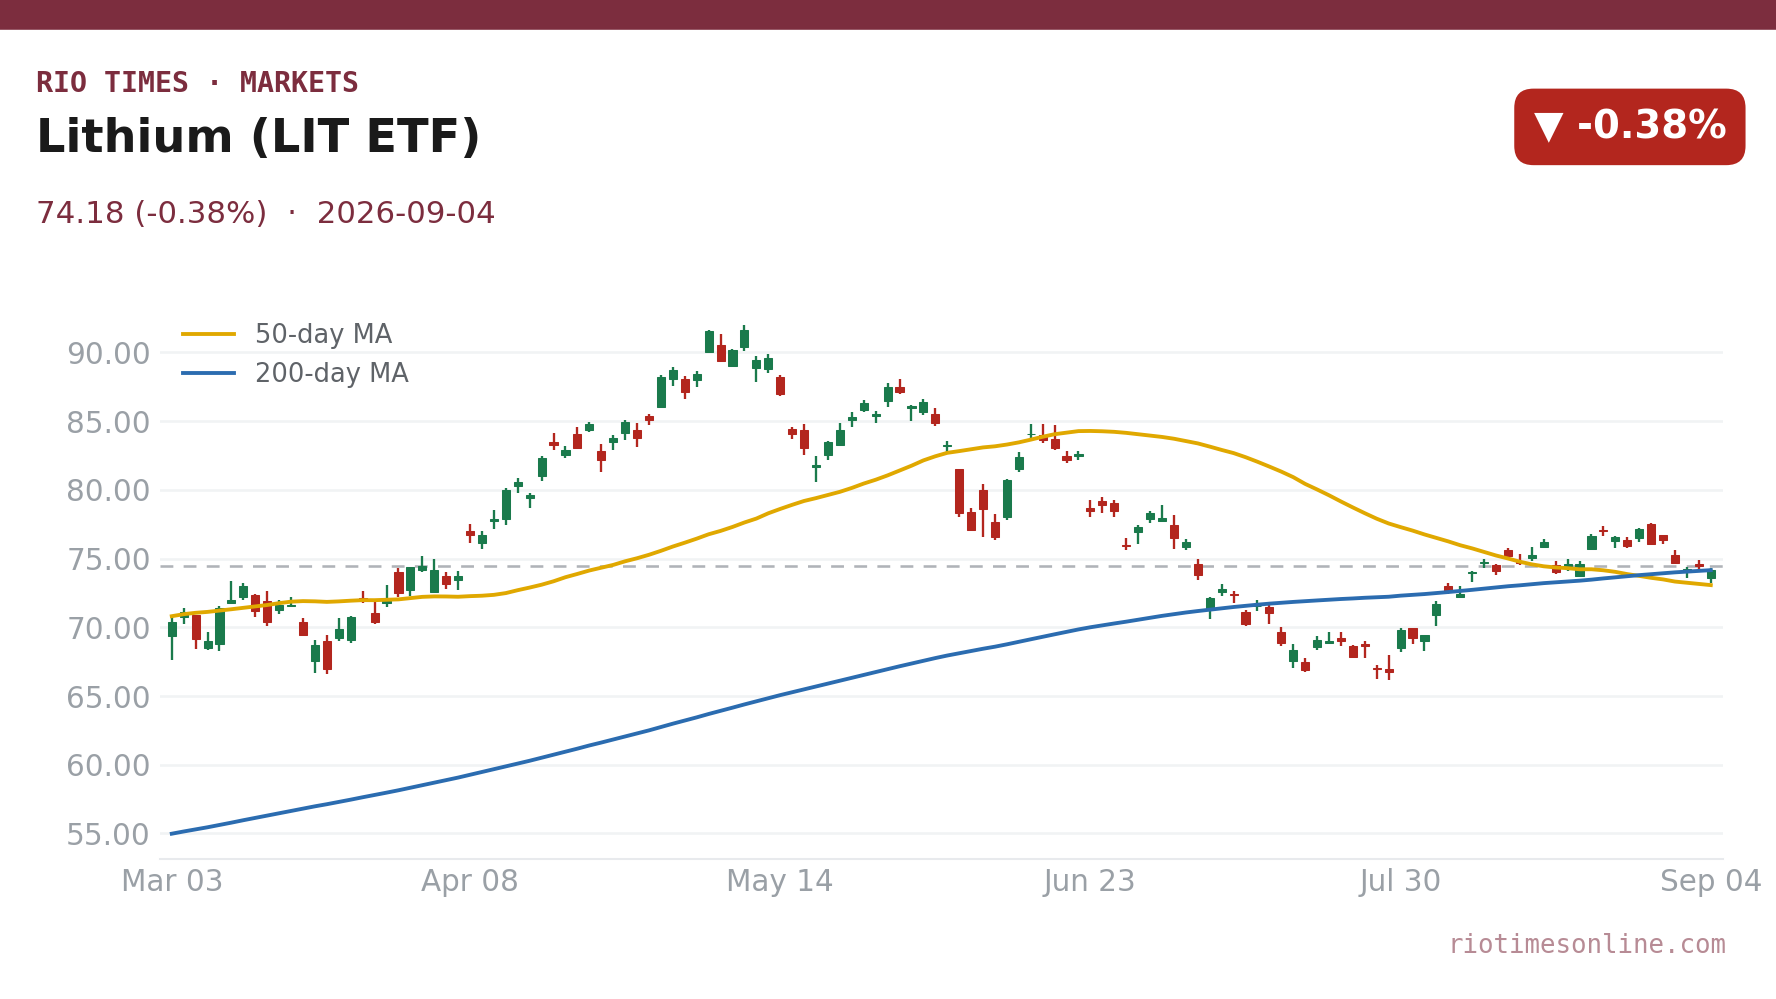
- LIT slipped 0.38% to US$74.18 on Friday, September 4, 2026, holding up far better than two of its biggest components.
- Albemarle dropped 4.45% to US$126.28, the sharpest fall among the names we track for the Lithium Triangle.
- SQM declined 4.20% to US$76.43, confirming that equity pressure hit major producers harder than the commodity basket.
- South American lithium carbonate FOB rose 1.50% on the session, even as the China lithium benchmark fell 2.56% to 152,000 CNY per ton.
- Battery-grade lithium carbonate averaged US$20,496.34 per tonne while battery-grade lithium hydroxide slipped to US$18,927.19 per tonne.
- Global X projects lithium demand could reach 3.6 MMt LCE by 2030 up from 1.6 million metric tonnes in 2025, driven by EVs and energy storage.
Today’s Focus
Friday delivered a split lithium tape: physical South American carbonate firmed 1.50%, but the listed producers fell sharply. Albemarle lost 4.45% to US$126.28 and SQM lost 4.20% to US$76.43, while the LIT miners ETF slipped only 0.38% to US$74.18.
The gap between the modest ETF dip and the steep single-stock drops points to company-specific selling rather than a collapse in lithium demand. The China lithium benchmark did weaken 2.56% to 152,000 CNY per ton, keeping Asian contract sentiment soft.
Still, battery-storage demand continued to support the physical market, and the Lithium Triangle of Chile, Argentina and Bolivia holds roughly 56% of global reserves. That keeps Albemarle and SQM central to any Western supply story.
What matters today. The lithium contract complex firmed in Latin America while the big Western producers’ shares were sold, signalling equity-level pressure rather than a commodity collapse.
01 The session in one read
Lithium investors saw a curious split on Friday, September 4, 2026. The broad lithium-miners ETF LIT slipped just 0.38% to US$74.18, while two of the sector’s biggest Western names fell hard.
Albemarle dropped 4.45% to US$126.28, and SQM declined 4.20% to US$76.43. That divergence suggests the selling was concentrated in the shares of large producers, not spread across every battery-related company.
T
h
e
s
e
s
s
i
o
n
r
e
a
d
s
a
s
a
r
o
t
a
t
i
o
n
o
u
t
o
f
m
a
j
o
r
l
i
t
h
i
u
m
e
q
u
i
t
i
e
s
,
n
o
t
a
d
o
w
n
g
r
a
d
e
o
f
l
i
t
h
i
u
m
i
t
s
e
l
f
.
W
i
t
h
L
I
T
d
o
w
n
o
n
l
y
0
.
3
8
%
a
g
a
i
n
s
t
A
l
b
e
m
a
r
l
e
d
o
w
n
4
.
4
5
%
,
t
h
e
p
r
e
s
s
u
r
e
w
a
s
c
o
m
p
a
n
y
–
s
p
e
c
i
f
i
c
.
W
a
t
c
h
w
h
e
t
h
e
r
S
Q
M
a
n
d
A
l
b
e
m
a
r
l
e
r
e
c
o
v
e
r
r
e
l
a
t
i
v
e
t
o
t
h
e
L
I
T
b
a
s
k
e
t
i
n
t
h
e
n
e
x
t
s
e
s
s
i
o
n
.
02 The board
The LIT ETF, a basket of lithium miners and battery-related firms rather than physical lithium, closed at US$74.18. Its 0.38% decline shows mild pressure on the sector as a whole.
But the single-stock moves tell a harsher story. Albemarle fell to US$126.28, down 4.45%, and SQM ended at US$76.43, down 4.20%, marking a clear underperformance by the two producers most tied to the Lithium Triangle.
| Asset | Level | Change |
|---|---|---|
| Lithium (LIT ETF) | US$74.18 | -0.38% |
| Albemarle | US$126.28 | -4.45% |
| SQM | US$76.43 | -4.20% |
Source: RT close, 2026-09-04. Where a commodity has no spot feed, an exchange-traded tracker or leading producer is shown as a labelled proxy.
Live Market IntelligenceThe live market board
Rio Times · Live Market Intelligence
Latin America — Cross-Market Board
| Instrument | Last | Change | YoY | Prev. | High | Low | Volume |
|---|---|---|---|---|---|---|---|
| IBOV | 185,147.15 | -0.02% | +21.85% | 185,188.13 | 168,310 | 167,142 | — |
| IPSA | 11,315.26 | -1.14% | — | 11,445.90 | 11,210 | 10,984 | 1,513,213,483 |
| IPC MEX | 64,866.61 | -0.87% | +12.17% | 65,436.16 | 66,121 | 65,405 | 108,886,187 |
| MERVAL | 3,049,121 | -0.29% | +30.51% | 3,022,485 | 3,042,365 | 2,991,150 | — |
| COLCAP | 2,544.56 | +0.40% | — | 9.04 | 9.05 | 9.02 | 4,133 |
| BVL PERÚ | 59,978.22 | -0.31% | — | — | — | — | — |
| USD/BRL | 5.16 | +0.01% | -5.13% | 5.16 | 5.18 | 5.14 | — |
| EUR/BRL | 5.95 | +1.01% | -5.83% | 5.89 | 5.98 | 5.94 | — |
| USD/MXN | 17.06 | -0.24% | -8.58% | 17.10 | 17.08 | 17.01 | — |
| USD/CLP | 913.98 | +0.04% | -5.67% | 913.65 | 915.11 | 906.68 | — |
| USD/COP | 3,140 | +0.03% | -22.04% | 3,139 | 3,141 | 3,105 | — |
| USD/PEN | 3.36 | -0.66% | -4.82% | 3.38 | 3.38 | 3.35 | — |
| USD/ARS | 1,493 | +0.10% | +12.96% | 1,491 | 1,494 | 1,480 | — |
| USD/UYU | 40.27 | +1.24% | +1.80% | 39.77 | 40.27 | 40.23 | — |
| USD/PYG | 5,939 | +1.68% | -19.54% | 5,841 | 5,939 | 5,925 | — |
| USD/BOB | 11.64 | -0.76% | +72.04% | 11.73 | 11.72 | 11.64 | — |
| USD/DOP | 58.34 | +1.25% | -3.44% | 57.62 | 58.34 | 58.04 | — |
| USD/CRC | 445.92 | +0.89% | -9.71% | 441.97 | 448.50 | 445.92 | — |
Live Company IntelligenceSociedad Quimica y Minera de Chile SA ADR B — the full investor dossier
Wall Street view
Valuation & profitability
Price & risk
$40.2952-wk high
$97.29
Revenue trend · 6y
Ownership
Dividend
03 What moved it
The physical lithium market gave mixed signals. South American lithium carbonate FOB rose 1.50% on the day, while the China lithium benchmark fell 2.56% to 152,000 CNY per ton, roughly US$22,650.
Battery-grade lithium carbonate averaged US$20,496.34 per tonne, and battery-grade lithium hydroxide fell to US$18,927.19 per tonne. Soft Chinese contract prices kept Asian sentiment cautious even as energy-storage demand lent support.
04 The Latin American read
Chile, Argentina and Bolivia form the Lithium Triangle, holding about 56% of global lithium reserves. That concentration keeps the region at the centre of any Western supply strategy.
Friday’s equity sell-off in Albemarle and SQM matters for foreign investors because these are the listed names most exposed to that reserve base. The firmer South American carbonate price suggests the regional physical market remains resilient.
05 The names to watch
Albemarle’s 4.45% drop to US$126.28 makes it the weakest of the three proxies we track. SQM’s 4.20% fall to US$76.43 left it only slightly less bruised.
LIT, by contrast, held up at US$74.18 with a 0.38% slip. That gap indicates the pain was in the big producers’ equity, not across the whole lithium-mining complex.
06 The outlook
Demand fundamentals still point upward: Global X estimates lithium consumption could rise from 1.6 million metric tonnes of lithium carbonate equivalent in 2025 to as much as 3.6 MMt LCE by 2030, led by electric vehicles, grid infrastructure and energy storage.
The question is whether producer shares can catch up with a physical market that firmed in Latin America even as Chinese benchmarks softened. A stabilisation in the China lithium price would likely be the clearest signal that the equity sell-off is overdone.
07 What to watch
- China lithium benchmark: Whether the 2.56% fall to 152,000 CNY per ton extends, because Asian contract softness has been the main drag on sentiment.
- Albemarle versus SQM: If Albemarle keeps underperforming SQM after Friday’s larger drop, it may signal company-specific concerns beyond the commodity.
- South American carbonate price: A 1.50% rise shows regional strength. Further gains would widen the gap with Chinese contracts and support Triangle producers.
- LIT ETF breadth: The ETF’s modest 0.38% decline suggests selling is narrow. Watch whether it holds above US$74 or follows the big miners lower.
Frequently Asked Questions
Why did Albemarle and SQM fall harder than LIT?
Albemarle dropped 4.45% and SQM 4.20%, while the LIT ETF slipped only 0.38%, pointing to concentrated selling in the largest producers’ shares rather than a broad lithium sell-off.
Is this a spot-lithium crash?
No. South American lithium carbonate FOB actually rose 1.50% on Friday, even though the China lithium benchmark fell 2.56% to 152,000 CNY per ton.
What is the Lithium Triangle?
It is the region of Chile, Argentina and Bolivia, which together hold about 56% of global lithium reserves.
Where is battery-grade lithium priced now?
Battery-grade lithium carbonate averaged US$20,496.34 per tonne, while battery-grade lithium hydroxide fell to US$18,927.19 per tonne in the session.
Market data: RT
This article was produced by The Rio Times’ automated newsroom system. How we use AI · Report an error
LatAm Markets: Live Signals → — real-time movers, turnover leaders and FX across Latin America.
Read More from The Rio Times