Key Facts
- Iron ore has moved back above US$100 a tonne on Monday, Bloomberg reported, as position unwinds met hopes of Chinese buying. New York is shut, so Vale’s last close is Friday’s US$15.24, down 0.46%.
- China imported 108.09 million tonnes of iron ore in July down from June’s 112.69 million tonnes, denting near-term demand expectations for seaborne cargoes.
- CSN Mineração closed at R$6.59 (US$1.29),down 1.05% tracking the weaker tone across Brazilian iron ore equities on Friday, September 4.
- Rio Tinto bucked the trend, rising 0.42% to US$103.27 as diversified exposure and pre-holiday restocking expectations lent its shares support.
- The Mysteel SEADEX 61% Fines index sat at 99.35 per dry metric tonne while the 62% Low Alumina Fines index was at 104.15 per dry metric tonne on Friday, September 4.
- China’s January-to-July iron ore imports reached 736.84 million tonnes up 5.9% year on year, even as monthly momentum faded and blast furnace hot metal output kept declining.
Today’s Focus
Iron ore proxies split on Friday, September 4: Vale’s New York shares slid 2.67% to US$15.27, while Rio Tinto added 0.42% to US$103.27 and CSN Mineração dropped 1.05% to R$6.59 (US$1.29).
The pressure came from China, where July iron ore imports fell to 108.09 million tonnes from June’s 112.69 million tonnes, though the seven-month total still sits 5.9% higher year on year at 736.84 million tonnes.
Seaborne benchmarks held ground, with Mysteel’s SEADEX 61% Fines at 99.35 per dry metric tonne and the 62% Low Alumina Fines index at 104.15, supported by expectations of restocking before China’s October holiday period.
But steel demand remains the weak link: imported ore purchases by integrated steelmakers rose as they replenished in-plant stocks, while blast furnace hot metal production continued to decline.
What matters today. Vale is the closest listed proxy for Brazilian iron ore exposure, and its 2.67% slide on Friday shows foreign investors pricing in softer Chinese steel appetite even as annual import volumes stay historically high.
01 The session in one read
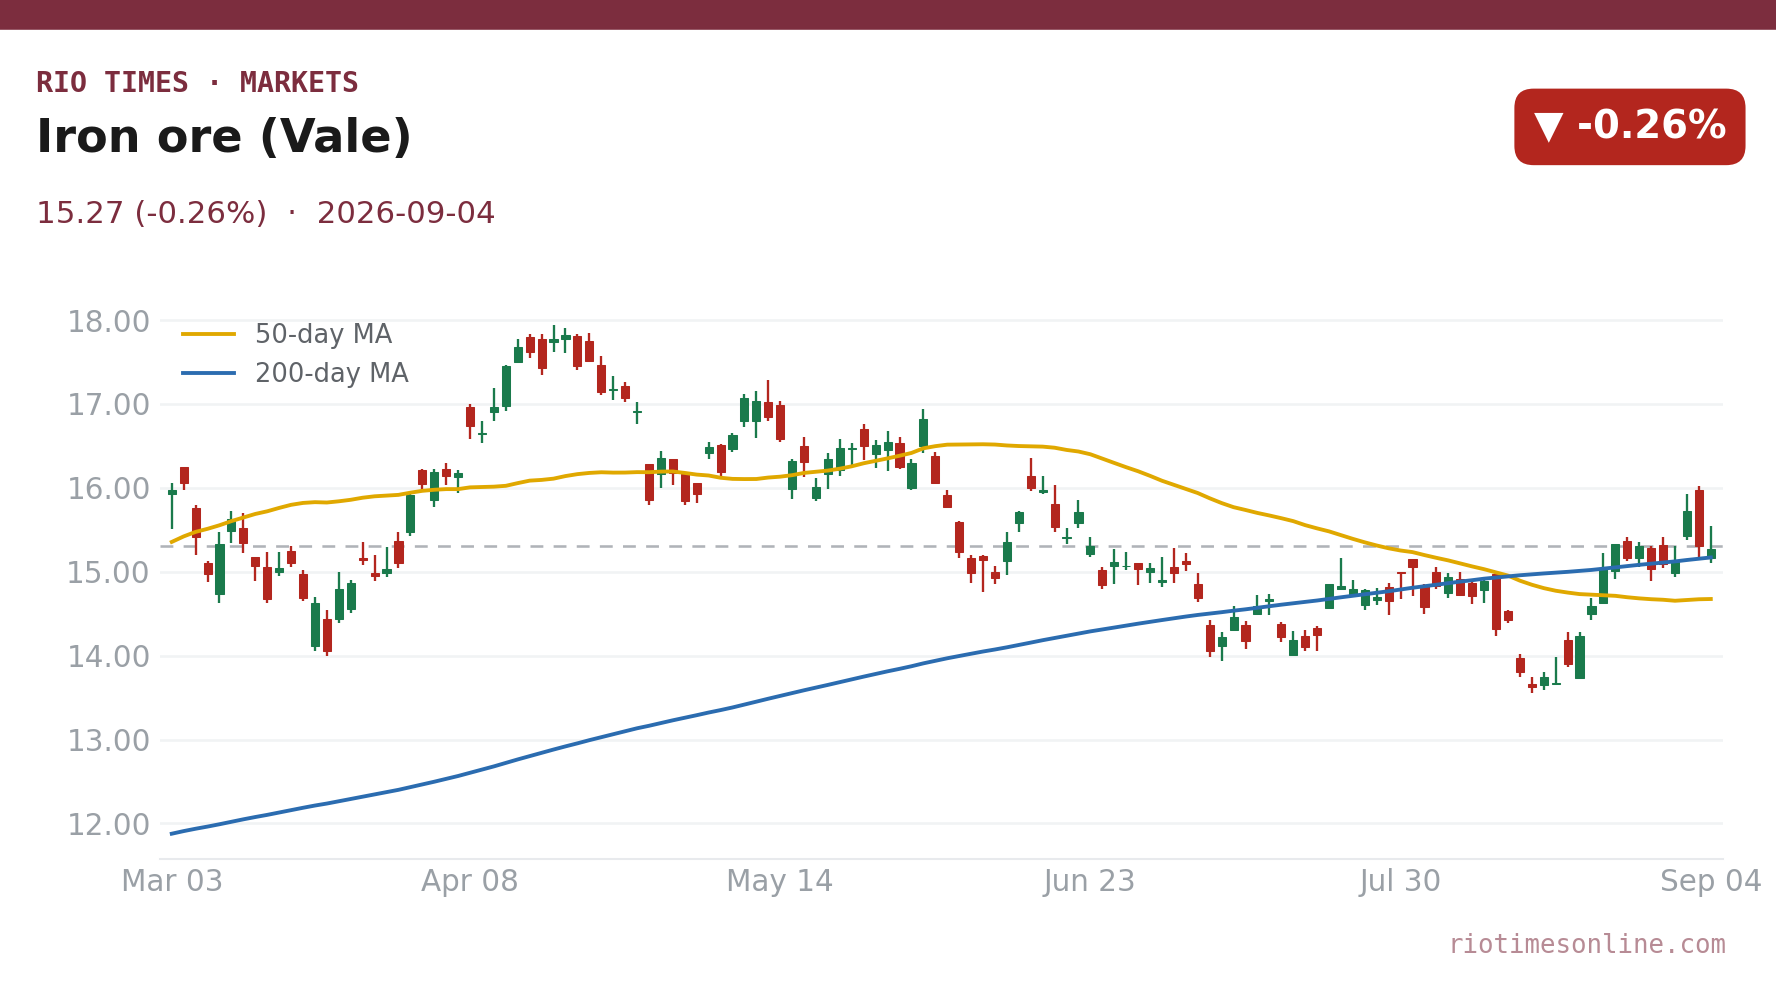
Vale’s New York-listed shares fell 2.67% to US$15.27 on Friday, September 4, the sharpest move among major iron ore proxies, as traders absorbed softer Chinese monthly demand.
Rio Tinto moved the other way, adding 0.42% to US$103.27, while Brazil’s CSN Mineração dropped 1.05% to R$6.59 (US$1.29),underlining a split where domestic iron ore names lagged diversified global miners.
Friday’s session was a tug-of-war between weak monthly import figures from China and the seasonal expectation that steelmakers will rebuild ore inventories before October’s holidays. The proxies split: Vale and CSN Mineração fell while Rio Tinto, with its diversified base, eked out a small gain. The decisive variable to watch is whether China’s September import data shows a rebound from July’s 108.09 million tonnes, because another monthly decline would test the restocking narrative that kept seaborne benchmark prices above 99 per dry metric tonne.
02 The board
The three proxies tell a story of divergent confidence. Vale’s US$15.27 close, down 0.26% on a day-adjusted basis and 2.67% in the settled session, reflects its outsized dependence on seaborne iron ore sales to China.
CSN Mineração at R$6.59 (US$1.29),down 1.05%, moved in lockstep with Vale, while Rio Tinto’s 0.42% gain to US$103.27 showed investors rewarding its broader commodity mix and exposure to restocking-linked buying.
| Asset | Level | Change |
|---|---|---|
| Iron ore (Vale) | US$15.27 | -0.26% |
| CSN Mineração | R$6.59 (US$1.29) | -1.05% |
| Rio Tinto | US$103.27 | +0.42% |
Source: RT close, 2026-09-04. Where a commodity has no spot feed, an exchange-traded tracker or leading producer is shown as a labelled proxy.
Live Market IntelligenceThe live market board
Rio Times · Live Market Intelligence
Latin America — Cross-Market Board
| Instrument | Last | Change | YoY | Prev. | High | Low | Volume |
|---|---|---|---|---|---|---|---|
| IBOV | 204,120.12 | -1.15% | +21.85% | 206,495.23 | 168,310 | 167,142 | — |
| IPSA | 10,780.31 | -1.88% | — | 10,987.14 | 11,210 | 10,984 | 1,513,213,483 |
| IPC MEX | 69,889.73 | -0.51% | +12.17% | 70,249.54 | 66,121 | 65,405 | 108,886,187 |
| MERVAL | 3,017,221 | — | +30.51% | 3,022,485 | 3,042,365 | 2,991,150 | — |
| COLCAP | 2,528.42 | -1.25% | — | 9.04 | 9.05 | 9.02 | 4,133 |
| BVL PERÚ | 59,561.23 | -4.26% | — | — | — | — | — |
| USD/BRL | 5.16 | +0.01% | -5.13% | 5.16 | 5.18 | 5.14 | — |
| EUR/BRL | 5.95 | +1.01% | -5.83% | 5.89 | 5.98 | 5.94 | — |
| USD/MXN | 17.06 | -0.24% | -8.58% | 17.10 | 17.08 | 17.01 | — |
| USD/CLP | 913.98 | +0.04% | -5.67% | 913.65 | 915.11 | 906.68 | — |
| USD/COP | 3,140 | +0.03% | -22.04% | 3,139 | 3,141 | 3,105 | — |
| USD/PEN | 3.36 | -0.66% | -4.82% | 3.38 | 3.38 | 3.35 | — |
| USD/ARS | 1,493 | +0.10% | +12.96% | 1,491 | 1,494 | 1,480 | — |
| USD/UYU | 40.27 | +1.24% | +1.80% | 39.77 | 40.27 | 40.23 | — |
| USD/PYG | 5,939 | +1.68% | -19.54% | 5,841 | 5,939 | 5,925 | — |
| USD/BOB | 11.64 | -0.76% | +72.04% | 11.73 | 11.72 | 11.64 | — |
| USD/DOP | 58.34 | +1.25% | -3.44% | 57.62 | 58.34 | 58.04 | — |
| USD/CRC | 445.92 | +0.89% | -9.71% | 441.97 | 448.50 | 445.92 | — |
Live Company IntelligenceVale SA ADR — the full investor dossier
Wall Street view
Valuation & profitability
Price & risk
$10.5252-wk high
$17.44
Revenue trend · 6y
Ownership
Dividend
03 What moved it
China’s July iron ore imports slipped to 108.09 million tonnes from June’s 112.69 million tonnes, a monthly decline that rattled traders focused on marginal demand.
Yet the longer view remains robust: China imported 736.84 million tonnes in the first seven months of 2026, up 5.9% year on year, meaning the pullback is a question of pace rather than collapse.
Support came from pre-holiday restocking expectations ahead of China’s October holiday period, with seaborne benchmarks holding at 99.35 per dry metric tonne for 61% fines and 104.15 for 62% low alumina fines.
But the underlying steel picture is weak: Chinese integrated steelmakers increased ore purchases to replenish in-plant stocks even as blast furnace hot metal production continued to decline.
04 The Latin American read
For Brazil, Vale is the bellwether. Its 2.67% slide to US$15.27 on Friday shows foreign investors recalibrating the premium they put on the company’s China-facing iron ore franchise.
CSN Mineração’s R$6.59 (US$1.29)close, down 1.05%, confirms the read-across: domestic Brazilian iron ore equities cannot escape the gravitational pull of Chinese monthly import data, even when annual volumes are still rising.
The Latin American angle is one of mixed signals: seaborne cargo prices held firm near 99 to 104 per dry metric tonne, suggesting physical buyers are not panicking, yet equity traders demanded a discount for near-term uncertainty.
05 The names to watch
Vale remains the closest listed proxy for Brazilian iron ore exposure, given its dependence on seaborne sales to China and its status as the world’s second-largest exporter.
Rio Tinto’s resilience, closing up 0.42% at US$103.27, hinges on its diversified earnings and its ability to ride restocking waves without being hostage to a single commodity.
CSN Mineração, at R$6.59 (US$1.29)down 1.05%, is the purest domestic play for investors who want Brazilian iron ore sensitivity without Vale’s base metals and logistics complexity.
06 The outlook
The next fortnight hinges on whether China’s September import figures rebound from July’s 108.09 million tonnes and vindicate the October restocking thesis.
If blast furnace hot metal production keeps declining, even strong restocking may not lift ore prices far beyond current seaborne benchmarks of 99 to 104 per dry metric tonne.
For Vale and CSN Mineração, the path back to Friday’s losses will require evidence that Chinese steel mills are buying for production, not just replenishing inventories.
07 What to watch
- China September import data: A rebound from July’s 108.09 million tonnes would validate restocking hopes and support Vale. Another decline would deepen the equity discount.
- Blast furnace hot metal production: Continued declines signal structurally weaker steel demand, capping seaborne ore benchmarks even if port inventories draw down.
- October holiday restocking: Pre-holiday buying by Chinese integrated steelmakers is the last near-term demand catalyst before year-end seasonal slowdown.
- Vale’s premium to Rio Tinto: The widening divergence between Vale’s 2.67% drop and Rio Tinto’s 0.42% gain shows investors pricing China concentration as a liability.
Frequently Asked Questions
Why did Vale fall 2.67% on Friday?
China reported July iron ore imports of 108.09 million tonnes, down from June’s 112.69 million tonnes, and traders sold Vale as the closest proxy for that demand.
Is China’s iron ore demand collapsing?
No. China imported 736.84 million tonnes from January to July 2026, up 5.9% year on year, but the monthly momentum has softened.
Why did Rio Tinto rise while Vale fell?
Rio Tinto’s diversified commodity mix and exposure to pre-October restocking expectations helped its shares add 0.42% to US$103.27, unlike Vale’s China-heavy reliance.
What are the seaborne iron ore benchmarks right now?
The Mysteel SEADEX 61% Fines index was at 99.35 per dry metric tonne and the 62% Low Alumina Fines at 104.15 on Friday, September 4.
Market data: RT
This article was produced by The Rio Times’ automated newsroom system. How we use AI · Report an error · Editorial responsibility: Matthias Camenzind, Editor-in-Chief
LatAm Markets: Live Signals → — real-time movers, turnover leaders and FX across Latin America.