Corn Slumps as USDA Stocks Top Every Estimate; Soybeans Hold Steadier
Key Facts
- USDA corn shock: US corn stocks on 1 September were 2.095 billion bushels, up 35% from a year earlier and above every analyst estimate; the average forecast was 1.924 billion.
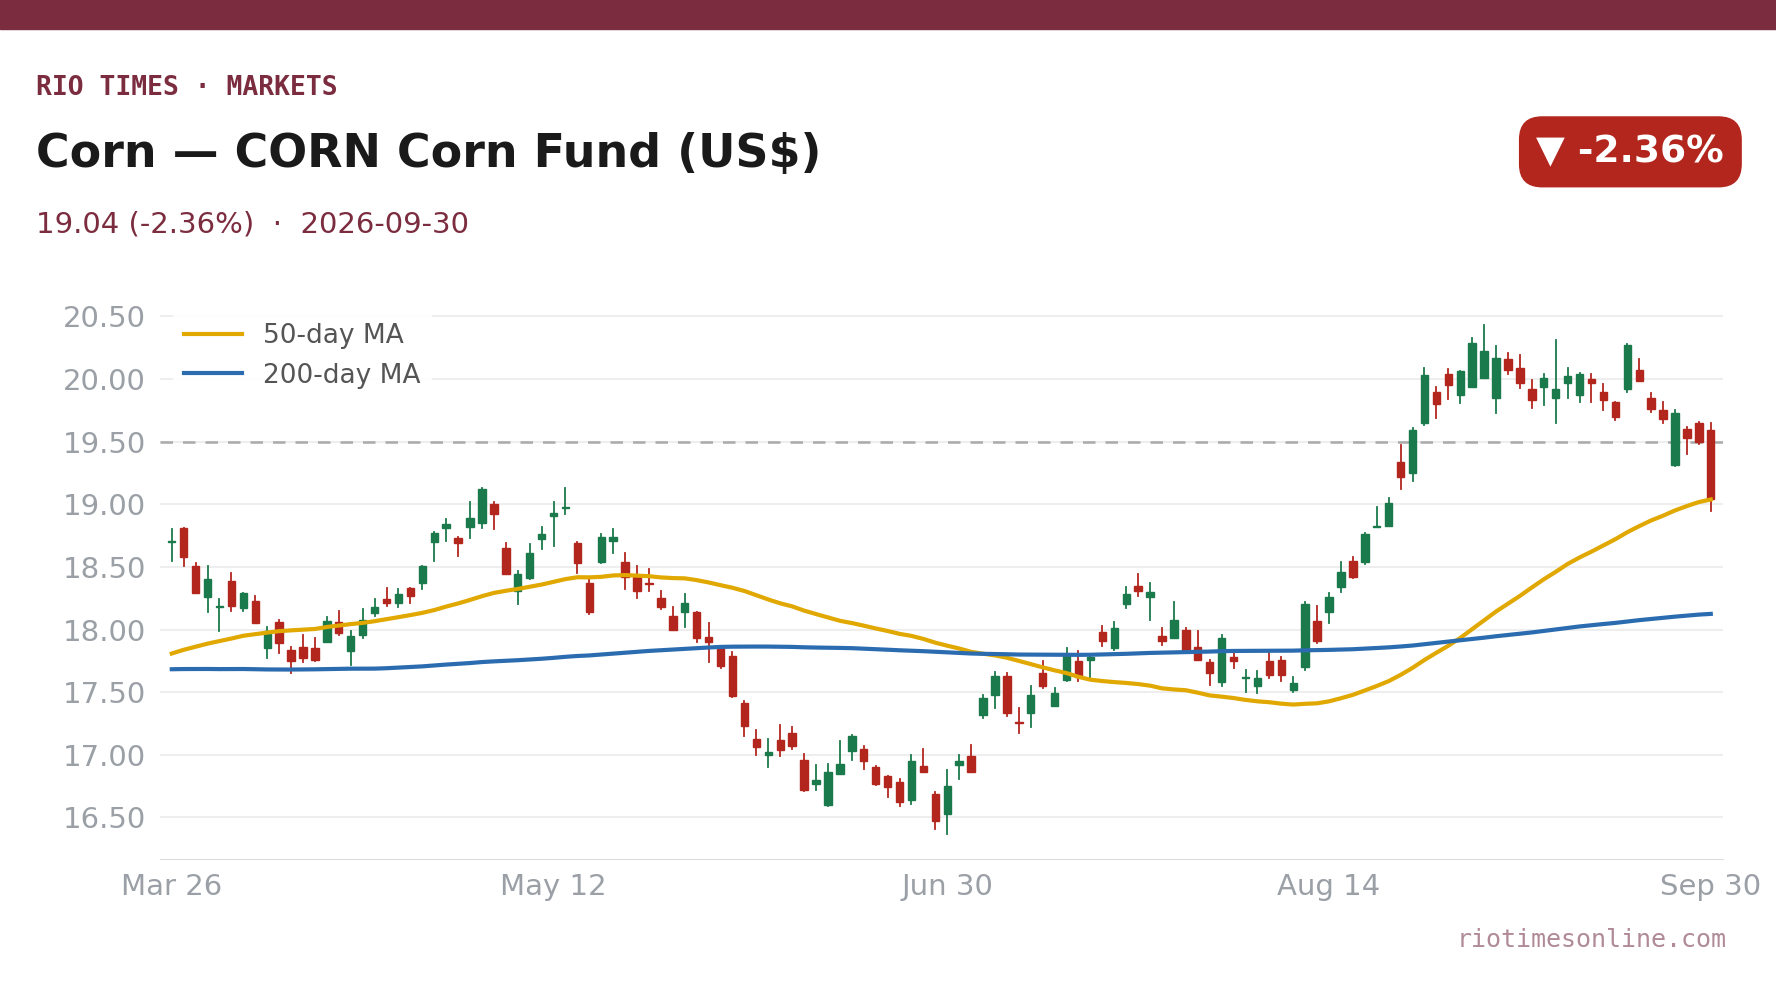
- Corn futures slumped: December corn fell 21¼ cents to US$5.00¾ a bushel, a five-week low, and the CORN fund lost 2.36% to US$19.04.
- Wheat followed: December Chicago wheat fell 17 cents to US$6.75¾, a six-week low, and the WEAT fund dropped 1.92% to US$24.57.
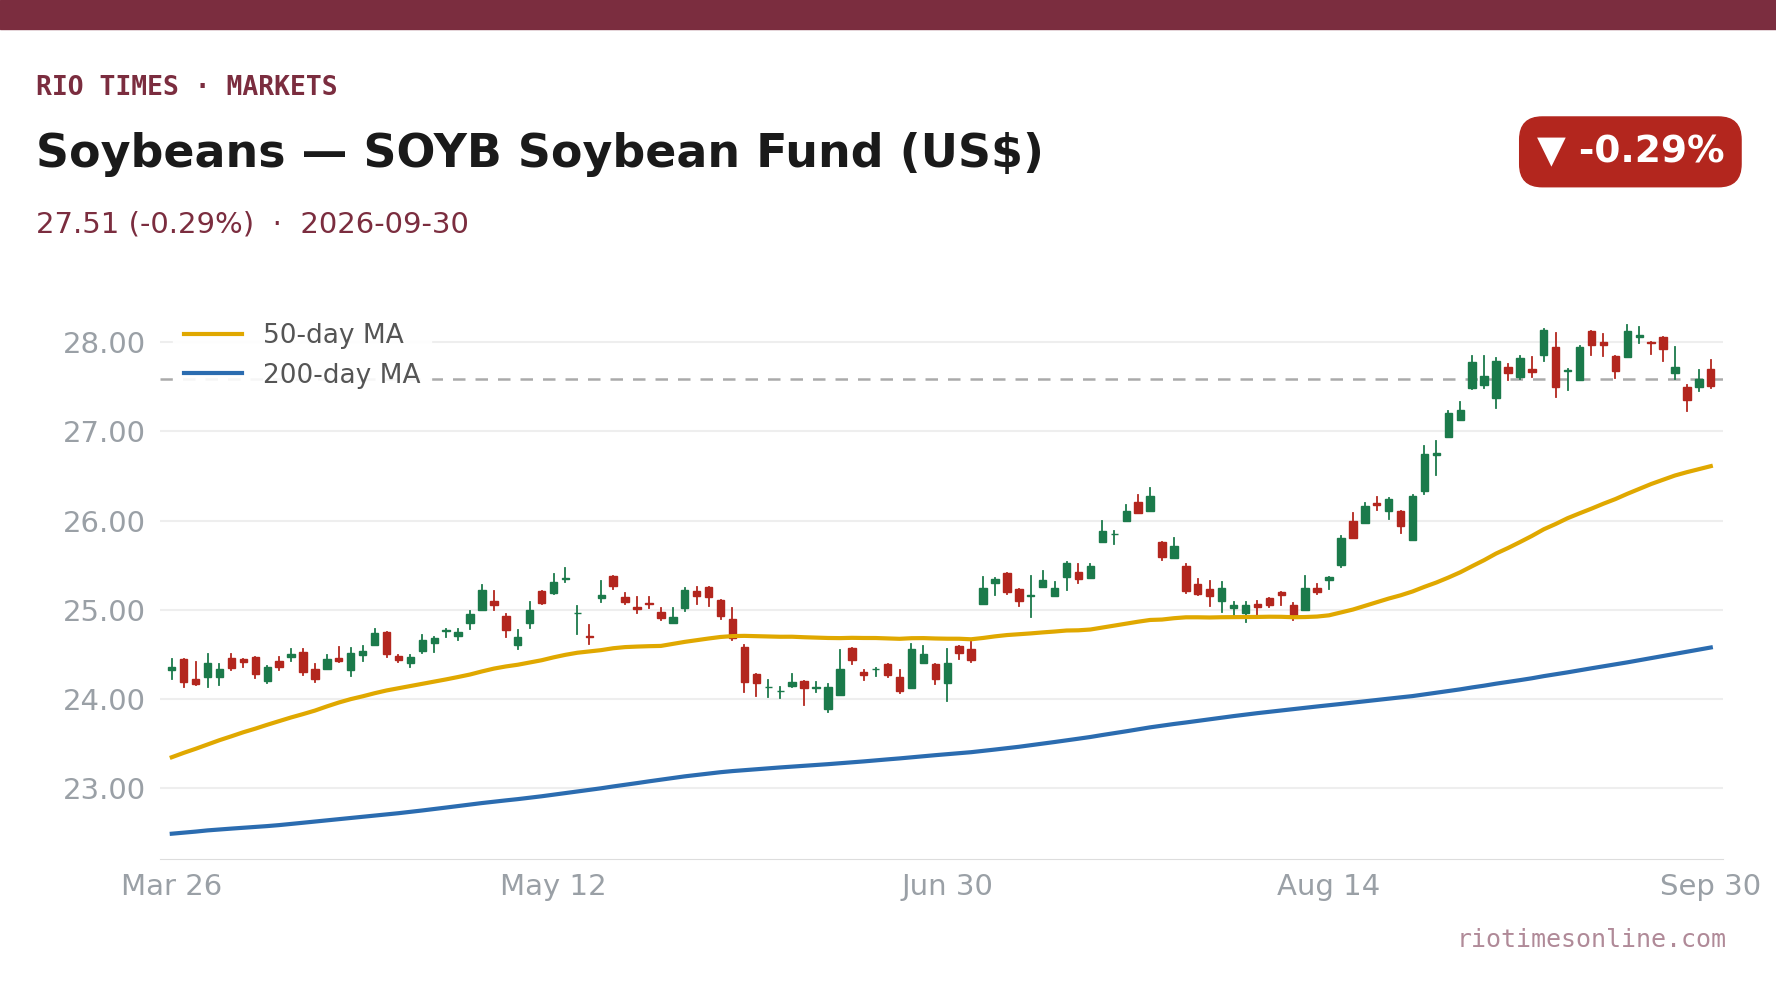
- Soybeans held up better: stocks of 315 million bushels came in below the 323 million expected; November futures slipped 4¾ cents to US$12.93 and the SOYB fund eased 0.29% to US$27.51.
- Brazil’s soybean planting reached 3.4% of the expected area by 24 September, slightly ahead of 3.2% a year earlier, AgRural said.
- Argentina’s core farm region is dry: about 70% faces water shortage or drought, and corn planting there is at 55% against 60% a year earlier.
Today’s Focus
Corn fell hard on Wednesday, 30 September 2026, after a US government report found far more old-crop corn than traders expected. The USDA put stocks on 1 September at 2.095 billion bushels, 171 million above the average forecast and above the top of the range of estimates.
December corn futures fell 21¼ cents to US$5.00¾ a bushel, a five-week low. The CORN fund lost 2.36% to US$19.04, its biggest one-day fall since mid-May.
Wheat followed corn lower even though wheat stocks were in line with forecasts. Soybeans were steadier because their stocks came in below expectations.
For South America, a bigger US surplus means more competition for corn exports, just as Brazil’s planting gets going and Argentina’s core region waits for rain.
What matters today. The USDA number resets the old-crop corn balance. Large leftover stocks and a harvest under way leave little room for a quick rebound.
01 The session in one read
Wednesday’s grain session was a corn story. The CORN fund dropped 2.36% to US$19.04, its lowest close since 21 August, after the USDA Grain Stocks report showed old-crop corn supplies far above expectations.
Wheat lost ground with corn: the WEAT fund fell 1.92% to US$24.57, its lowest close since 13 August. The SOYB fund eased just 0.29% to US$27.51.
The corn figure was the surprise of the quarter: 2.095 billion bushels, 35% more than a year earlier and above every pre-report estimate. Large leftover stocks mean more supply carried into the new marketing year, just as the US harvest gathers pace. Soybeans held up because their stocks came in tight. For Latin America, plentiful US corn competes with Brazilian and Argentine exports; the variables to watch now are rain in Argentina’s core belt and the pace of Brazil’s planting.
02 The board
On the proxy board, corn was the clear laggard. CORN settled at US$19.04, down 2.36%. December corn futures fell 21¼ cents to US$5.00¾ a bushel, near the session low.
WEAT, the wheat tracker, closed at US$24.57, down 1.92%. December Chicago wheat fell 17 cents to US$6.75¾ and Kansas City hard red winter wheat 10 cents to US$7.33, both six-week lows. SOYB ended at US$27.51, down 0.29%, while November soybeans lost 4¾ cents to US$12.93. Brazilian farmland group SLC Agrícola rose 0.36% in São Paulo to R$16.81 (about US$3.25).
| Asset | Level | Change |
|---|---|---|
| Soybeans (SOYB) | US$27.51 | -0.29% |
| Corn (CORN) | US$19.04 | -2.36% |
| Wheat (WEAT) | US$24.57 | -1.92% |
Source: RT close, 2026-09-30. Where a commodity has no spot feed, an exchange-traded tracker or leading producer is shown as a labelled proxy.
Live Market IntelligenceThe live market board
Rio Times · Live Market Intelligence
Latin America — Cross-Market Board
| Instrument | Last | Change | YoY | Prev. | High | Low | Volume |
|---|---|---|---|---|---|---|---|
| IBOV | 186,340.46 | +1.37% | +21.85% | 183,827.59 | 168,310 | 167,142 | — |
| IPSA | 10,969.49 | -0.78% | — | 11,055.94 | 11,210 | 10,984 | 1,513,213,483 |
| IPC MEX | 64,214.36 | -1.38% | +12.17% | 65,110.57 | 66,121 | 65,405 | 108,886,187 |
| MERVAL | 2,819,323 | +1.32% | +30.51% | 3,022,485 | 3,042,365 | 2,991,150 | — |
| COLCAP | 2,549.16 | -0.38% | — | 9.04 | 9.05 | 9.02 | 4,133 |
| BVL PERÚ | 60,410.88 | -0.96% | — | — | — | — | — |
| USD/BRL | 5.16 | +0.01% | -5.13% | 5.16 | 5.18 | 5.14 | — |
| EUR/BRL | 5.95 | +1.01% | -5.83% | 5.89 | 5.98 | 5.94 | — |
| USD/MXN | 17.06 | -0.24% | -8.58% | 17.10 | 17.08 | 17.01 | — |
| USD/CLP | 913.98 | +0.04% | -5.67% | 913.65 | 915.11 | 906.68 | — |
| USD/COP | 3,140 | +0.03% | -22.04% | 3,139 | 3,141 | 3,105 | — |
| USD/PEN | 3.36 | -0.66% | -4.82% | 3.38 | 3.38 | 3.35 | — |
| USD/ARS | 1,493 | +0.10% | +12.96% | 1,491 | 1,494 | 1,480 | — |
| USD/UYU | 40.27 | +1.24% | +1.80% | 39.77 | 40.27 | 40.23 | — |
| USD/PYG | 5,939 | +1.68% | -19.54% | 5,841 | 5,939 | 5,925 | — |
| USD/BOB | 11.64 | -0.76% | +72.04% | 11.73 | 11.72 | 11.64 | — |
| USD/DOP | 58.34 | +1.25% | -3.44% | 57.62 | 58.34 | 58.04 | — |
| USD/CRC | 445.92 | +0.89% | -9.71% | 441.97 | 448.50 | 445.92 | — |
03 What moved it
Corn fell because US stocks were far above trade guesses. The USDA’s National Agricultural Statistics Service counted 2.095 billion bushels on 1 September, against an average analyst forecast of 1.924 billion and a range of 1.860–2.005 billion. Of the total, 787 million bushels were on farms and 1.31 billion in elevators and other off-farm storage.
Harvest pressure added to the move. The US corn harvest was 18% complete by 27 September, in line with the five-year average, with 57% of the crop rated good to excellent.
Wheat fell on spillover selling. Wheat stocks of 1.846 billion bushels were close to the 1.849 billion expected and down 14% from a year earlier. The USDA’s Small Grains Summary put 2026 US wheat production at 1.534 billion bushels, down from 1.985 billion in 2025.
Soybean stocks were tight: 315 million bushels, below the 323 million forecast and down 3% from a year earlier. That cushioned soybeans, though they still slipped with the rest of the complex. The dollar index edged up 0.08% to 101.45, a small headwind for dollar-priced grain.
04 Wednesday’s data, one by one
Tuesday’s edition promised four grain markers for Wednesday. Here is what happened.
USDA Quarterly Grain Stocks (1 September): bearish for corn. Corn stocks were 2.095 billion bushels against 1.924 billion expected, up 35% from a year earlier. Soybeans were 315 million bushels against 323 million expected, down 3%. Wheat was 1.846 billion bushels against 1.849 billion expected, down 14%. December corn fell 21¼ cents, November soybeans 4¾ cents and December wheat 17 cents.
US energy inventories (EIA, week to 25 September): weaker ethanol. Ethanol output fell 21,000 barrels a day to 1.007 million barrels a day, the lowest since January, a softer signal for corn demand. Ethanol stocks fell to 23.87 million barrels.
US data: firmer jobs, softer inflation. ADP private payrolls rose by 90,000 in September, above the 70,000 forecast. Core PCE inflation held at 3.0% a year in August, below the 3.3% forecast. The Chicago PMI jumped to 58.8, far above the 51.2 forecast. The dollar index still edged up 0.08%.
Brazil fiscal data (August): a wider deficit. The consolidated public sector ran a primary deficit of R$10.0 billion (about US$1.93 billion), and gross government debt rose to 82.9% of GDP, the central bank said. The real still firmed 0.53% to 5.1743 per US dollar, which lowers what Brazilian farmers receive in reais for dollar-priced exports.
05 The Latin American read
Brazilian soybean planting reached 3.4% of the expected area by 24 September, slightly ahead of 3.2% a year earlier, led by Paraná, consultancy AgRural said. Summer corn planting in the Centre-South reached 34%, against 32% a year earlier.
Argentina is under more visible stress. Corn planting in the core region covered 55% of the intended area, against 60% a year earlier, and about 70% of the region faces water shortage or drought, the Rosario Board of Trade said in its 24 September report. Dry soils are also cutting wheat yield prospects.
A big US corn surplus is unwelcome for both countries. It means more competition for export buyers in the months when South American corn is shipped.
06 The names to watch
China left soybeans out of the tariff cuts it announced on 28 September, so US beans still carry an extra 10% duty while US corn and wheat get relief. Chinese state buyers Sinograin and COFCO have bought more than 12 million tonnes of US soybeans, but the duty keeps Brazil’s price edge in the world’s largest soybean market.
SLC Agrícola, the listed Brazilian farmland group, rose 0.36% on Wednesday. Its margins depend on grain prices in reais as well as in US dollars, so a firmer real cuts both ways.
07 The outlook
The USDA corn surprise will keep the market defensive while the US harvest gathers pace. Traders will now look to South American weather to offset the bearish US supply picture: rain in Argentina’s core belt and the speed of Brazil’s planting are the two variables that matter most. Mainland China, the largest soybean buyer, is on holiday until 7 October.
08 What to watch
- China Golden Week: mainland markets, including Dalian soybean and corn futures, are closed from 1 to 7 October, so Chinese buying signals will be scarce.
- US data, 9.30 am BRT (12.30 UTC) and 11 am BRT (14.00 UTC): weekly jobless claims (forecast 200,000) and the ISM manufacturing index (forecast 55.0 after 54.6), both dollar drivers.
- Brazil manufacturing PMI, 10 am BRT (13.00 UTC): S&P Global’s September reading, forecast 46.5 after 46.3.
- Argentina rainfall: the Rosario Board of Trade’s next weekly report will show whether rain has reached the dry core region and sped up corn planting.
- US harvest pace: the USDA’s weekly crop progress report on Monday will show whether corn harvesting keeps up with the five-year average.
Frequently Asked Questions
Why did corn fall so sharply?
The USDA said US corn stocks on 1 September were 2.095 billion bushels, 35% more than a year earlier and above every analyst estimate. December corn futures fell 21¼ cents to US$5.00¾ a bushel.
Why did soybeans hold up better?
US soybean stocks were 315 million bushels, below the 323 million expected. November futures slipped only 4¾ cents to US$12.93 a bushel.
What is hurting Argentina?
About 70% of its core farm region faces water shortage or drought, and corn planting there is at 55% of the intended area against 60% a year earlier, the Rosario Board of Trade said.
How is Brazil’s soybean planting going?
Planting reached 3.4% of the expected area by 24 September, slightly ahead of 3.2% a year earlier, consultancy AgRural said.
Source: RT live market data, close of Wednesday 30 September 2026.
This article was produced by The Rio Times’ automated newsroom system. How we use AI · Report an error
LatAm Markets: Live Signals → — real-time movers, turnover leaders and FX across Latin America.
Read More from The Rio Times