IBOV 186,340.46 ▲ 1.37% IPSA 10,969.49 ▼ 0.78% IPC MEX 64,951.10 ▼ 0.24% MERVAL 2,819,323 ▲ 1.32% COLCAP 2,549.16 ▼ 0.38% BVL PERÚ 60,410.88 ▼ 0.96% USD/BRL5.18▼ 0.34% USD/MXN18.08▲ 0.16% USD/CLP972.03▼ 0.10% USD/COP3,292▼ 2.26% USD/PEN3.44▲ 0.01% USD/ARS1,525▼ 0.03% USD/UYU40.24▲ 3.55% USD/PYG5,817▲ 2.25% USD/BOB11.97▲ 0.66% USD/DOP59.30▲ 0.17% USD/CRC454.26▲ 3.19% USD/GTQ7.64▲ 3.18% USD/HNL26.86▲ 0.43% USD/NIO36.62▲ 0.34% USD/VES856.92▼ 0.13% USD/PAB1.00— 0.00% USD/BZD2.00— 0.00% USD/JMD 157.28 — 0.00% USD/TTD6.72▲ 2.14% EUR/BRL5.87▼ 1.05% BRENT 88.88 ▼ 0.03% WTI 83.11 ▼ 0.11% IRON ORE 161.91 — — COPPER 6.61 ▲ 0.03% GOLD 4,461 ▲ 1.78% SILVER 65.59 ▲ 1.26% SOY 1,184 ▲ 3.20% CORN 480.50 ▲ 10.02% WHEAT 655.00 ▲ 3.93% COFFEE 317.25 ▼ 5.51% SUGAR 16.43 ▼ 1.79% ORANGE JUICE 138.55 ▼ 0.47% COTTON 85.03 ▲ 2.33% COCOA 5,719 ▲ 3.18% BEEF 223.60 ▼ 3.93% CATTLE 339.10 ▼ 3.16% LITHIUM 75.20 ▲ 1.47% PETR4 41.64 ▼ 0.05% VALE3 72.97 ▲ 0.83% ITUB4 38.60 ▼ 1.03% BBDC4 16.85 ▲ 0.36% ABEV3 14.89 ▼ 0.80% BBAS3 19.37 ▲ 0.47% B3SA3 14.26 ▼ 0.21% WEGE3 47.59 ▲ 0.49% PRIO3 59.14 ▼ 0.19% SUZB3 41.33 ▲ 2.35% RENT3 34.68 ▼ 0.09% AZZA3 15.89 ▼ 2.63% CSAN3 3.22 ▼ 1.83% RAIZ4 0.25 — 0.00% PCAR3 2.75 ▼ 0.36% GMAT3 3.65 ▼ 1.08% PSSA3 48.13 ▼ 0.54% CVCB3 1.33 ▼ 2.92% POSI3 3.36 ▲ 2.44% SLCE3 13.34 ▲ 0.30% NATU3 8.14 ▼ 0.73% IBOV 186,340.46 ▲ 1.37% IPSA 10,969.49 ▼ 0.78% IPC MEX 64,951.10 ▼ 0.24% MERVAL 2,819,323 ▲ 1.32% COLCAP 2,549.16 ▼ 0.38% BVL PERÚ 60,410.88 ▼ 0.96% USD/BRL 5.16 ▲ 0.01% USD/MXN 17.06 ▼ 0.24% USD/CLP 913.98 ▲ 0.04% USD/COP 3,140 ▲ 0.03% USD/PEN 3.36 ▼ 0.66% USD/ARS 1,493 ▲ 0.10% USD/UYU 40.27 ▲ 1.24% USD/PYG 5,939 ▲ 1.68% USD/BOB 11.64 ▼ 0.76% USD/DOP 58.34 ▲ 1.25% USD/CRC 445.92 ▲ 0.89% USD/GTQ 7.62 ▲ 2.21% USD/HNL 26.79 ▲ 1.57% USD/NIO 36.62 ▲ 0.69% USD/VES 762.44 ▼ 0.13% USD/PAB 1.00 — 0.00% USD/BZD 2.00 — 0.00% USD/JMD 157.28 — 0.00% USD/TTD 6.70 ▲ 0.61% EUR/BRL 5.95 ▲ 1.01% BRENT 88.88 ▼ 0.03% WTI 83.11 ▼ 0.11% IRON ORE 161.91 — — COPPER 6.61 ▲ 0.03% GOLD 4,461 ▲ 1.78% SILVER 65.59 ▲ 1.26% SOY 1,184 ▲ 3.20% CORN 480.50 ▲ 10.02% WHEAT 655.00 ▲ 3.93% COFFEE 317.25 ▼ 5.51% SUGAR 16.43 ▼ 1.79% ORANGE JUICE 138.55 ▼ 0.47% COTTON 85.03 ▲ 2.33% COCOA 5,719 ▲ 3.18% BEEF 223.60 ▼ 3.93% CATTLE 339.10 ▼ 3.16% LITHIUM 75.20 ▲ 1.47% PETR4 41.64 ▼ 0.05% VALE3 72.97 ▲ 0.83% ITUB4 38.60 ▼ 1.03% BBDC4 16.85 ▲ 0.36% ABEV3 14.89 ▼ 0.80% BBAS3 19.37 ▲ 0.47% B3SA3 14.26 ▼ 0.21% WEGE3 47.59 ▲ 0.49% PRIO3 59.14 ▼ 0.19% SUZB3 41.33 ▲ 2.35% RENT3 34.68 ▼ 0.09% AZZA3 15.89 ▼ 2.63% CSAN3 3.22 ▼ 1.83% RAIZ4 0.25 — 0.00% PCAR3 2.75 ▼ 0.36% GMAT3 3.65 ▼ 1.08% PSSA3 48.13 ▼ 0.54% CVCB3 1.33 ▼ 2.92% POSI3 3.36 ▲ 2.44% SLCE3 13.34 ▲ 0.30% NATU3 8.14 ▼ 0.73%
since 2009
Wednesday, September 30, 2026

Gold Holds Near Record Highs as Global Tensions Support Prices

By · April 14, 2025 · 2 min read

The LatAm Brief

One email, every weekday morning. What moved in Latin American markets, politics and expat life.

Yesterday’s subject line: “Colombia decides rates today, near its own debt ceiling”

Free. We send a confirmation link first — nothing arrives until you click it. Unsubscribe with one click in any edition. If you stop opening us for 30 days we stop sending by ourselves, as we assume the interest is no longer there. See our privacy policy. We never share your email.

According to TradingView data published by mattcamen on April 14, 2025, gold prices are trading at $3,234.40 per ounce in early morning trading. The precious metal shows a minor decline of 0.01% from the previous session, remaining near its recent all-time highs.

The chart reveals gold’s impressive upward trajectory since early April, with prices climbing steadily from around $3,000 to current levels above $3,230. This rally represents a gain of approximately 7.8% in just two weeks, highlighting the strong bullish sentiment in the market.

Technical indicators on the chart suggest gold remains in a strong uptrend. The price is trading well above both the short-term and long-term moving averages, which are themselves sloping upward.

Free daily brief — no card needed
Get every Market Reports story in one morning email
We build you a personalized brief around the topics you follow — free for 7 days. Love it? Your first month after that is US$1.

This configuration typically signals robust underlying strength in the market. The day’s trading range has been established between $3,229.23 and $3,238.25, indicating relatively tight price action as traders assess the next directional move.

Volume patterns suggest institutional investors continue to accumulate positions despite the elevated price levels. Market analysts attribute gold’s persistent strength to several factors.
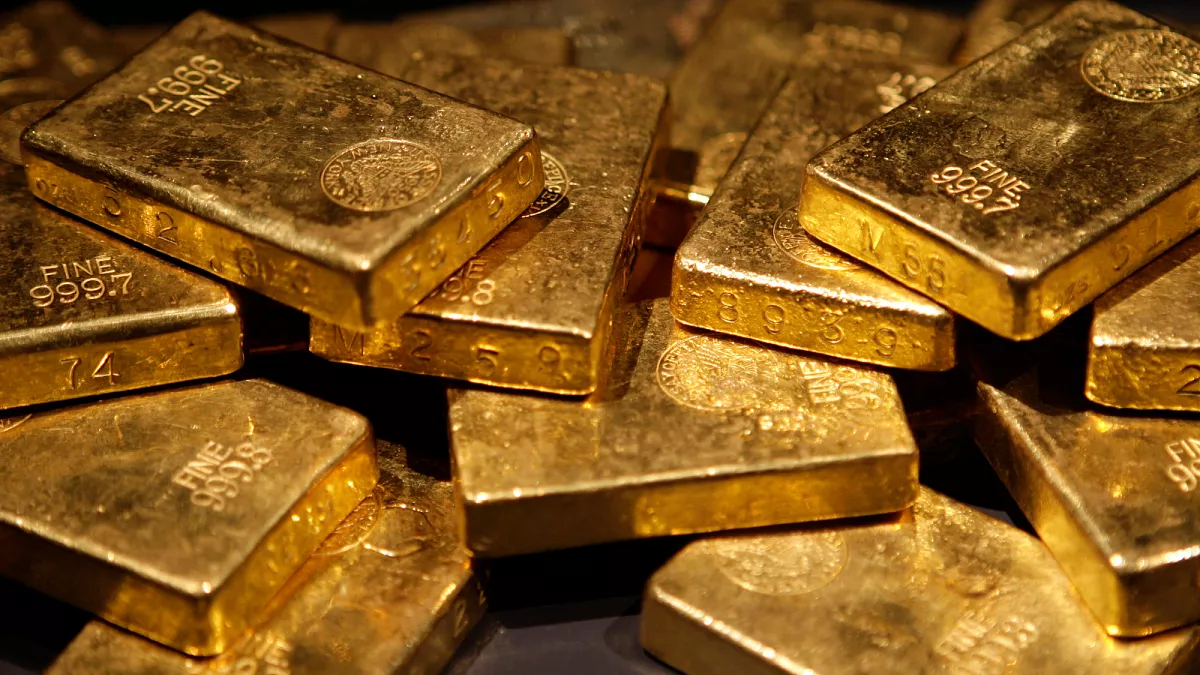
Gold Holds Near Record Highs as Global Tensions Support Prices
Gold Holds Near Record Highs as Global Tensions Support Prices.
One-stop reference
Company Intelligence
Every listed company in Latin America — financials, ownership and structure for 1,450+ companies across 26 exchanges, in one place.
Browse the directory →
RT
Ask Rio Times
Latin American markets, currencies and companies.
Open the full Ask Rio Times →

Ongoing trade tensions between major economies have fueled economic uncertainty, driving investors toward safe-haven assets. The recent implementation of new tariffs has particularly accelerated this trend. Currency market dynamics have also played a crucial role.

The U.S. dollar’s weakness against major currencies has made gold more attractive for international investors. This relationship continues to support higher gold prices even during minor pullbacks.

Gold’s Price Momentum Amid Central Bank Support

Central bank policies remain supportive of gold’s appeal. With inflation concerns lingering and expectations of potential interest rate adjustments, investors see gold as a hedge against monetary policy uncertainties.

Physical demand from Asian markets, particularly China and India, has remained robust. Chinese investors have been paying premiums above global spot prices, reflecting strong local demand amid economic concerns.

The institutional investment landscape shows continued interest in gold-backed financial products. ETF holdings have increased substantially in recent months, with inflows accelerating as prices reach new highs.

Looking ahead, traders are closely monitoring key resistance levels around $3,250, which could determine whether gold continues its upward march or enters a consolidation phase. Support levels near $3,210 should provide a floor for any potential pullbacks.

The current price action suggests gold may experience some short-term consolidation after its rapid ascent. However, the fundamental drivers supporting higher prices remain firmly in place, pointing to potential further gains in the coming weeks.

This article was produced by The Rio Times’ automated newsroom system. How we use AI · Report an error

LatAm Markets: Live Signals → — real-time movers, turnover leaders and FX across Latin America.

Read More from The Rio Times

The Rio Times · Power Map
See who really holds power in Latin America
Click to open the Power Map →

Rotate for Best Experience

This report is optimized for landscape viewing. Rotate your phone for the full experience.