Key Facts
- Copper futures settled higher on Thursday, September 3, 2026, with front-month COMEX contracts around the mid-US$6.5 per pound range, reinforcing copper’s role in the energy transition.
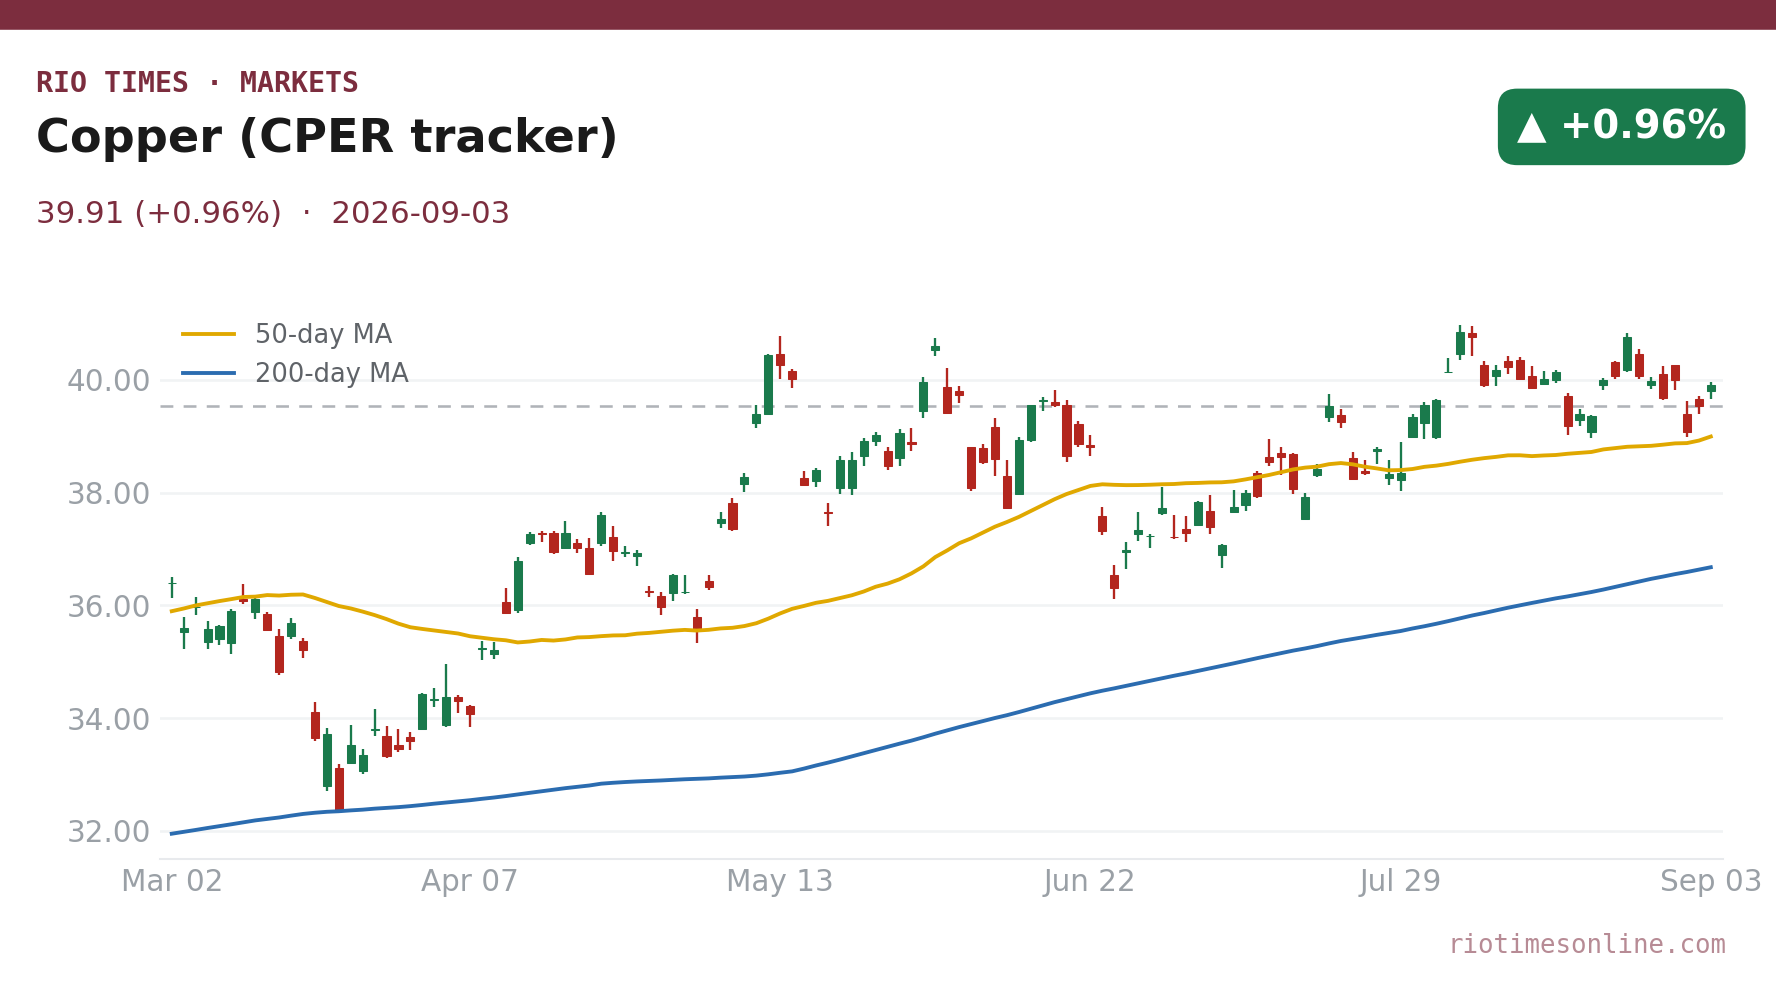
- CPER, the copper-tracking fund, closed at US$39.91, up 0.96% day on day, capturing futures moves rather than physical spot copper.
- Chile remains the world’s largest copper producer, with Peru third after the Democratic Republic of Congo overtook it in 2023, keeping Andean policy central to global mine output.
- Southern Copper’s New York shares fell 2.32% to US$199.53, while Freeport-McMoRan declined 1.85% to US$72.56 in the same session.
- State Grid Corporation of China plans US$105 billion of grid investment in 2026, a 9% increase on 2025, with ultra-high-voltage lines using roughly 5 to 8 tonnes of copper per kilometre.
- China’s NEV production rose 22.4% year-on-year to 1.554 million units in May 2026, with battery electric vehicles using about 83 kg of copper each versus 23 kg for combustion cars.
Today’s Focus
Copper futures settled higher on Thursday, September 3, 2026, with front-month COMEX contracts around the mid-US$6.5 per pound range. The copper-tracking fund CPER closed at US$39.91, up 0.96% day on day, reflecting futures-based exposure rather than physical metal.
The move came despite falls in major copper miners’ shares. Southern Copper dropped 2.32% to US$199.53, and Freeport-McMoRan lost 1.85% to US$72.56.
China’s copper demand is resilient, but its sources are changing. Property-related copper use is shrinking, but grid infrastructure, electric vehicles and renewables are more than offsetting that loss.
For Latin America, the stakes are clear. Chile and Peru supply much of the world’s copper, and their permitting decisions will shape how much reaches this market.
What matters today. Copper’s pull comes from China’s grid, EV and renewable build-out. Yet producer shares fell, showing equity investors want more than a rising futures curve.
01 The session in one read
Copper futures settled higher on Thursday, September 3, 2026, with front-month COMEX contracts around the mid-US$6.5 per pound range. That steady advance kept copper anchored to its core story as a beneficiary of China’s grid, electric vehicle and renewable build-out.
The copper-tracking fund CPER ended at US$39.91, up 0.96% day on day. CPER tracks COMEX futures through one to three contracts, so its move reflected expectations embedded in futures prices rather than physical spot metal.
Copper futures rose on Thursday, September 3, 2026, but the two large copper producers on our board fell, suggesting investors are distinguishing between commodity exposure and company-specific execution. CPER’s 0.96% gain to US$39.91 shows demand-side optimism, while Southern Copper’s 2.32% drop to US$199.53 and Freeport-McMoRan’s 1.85% decline to US$72.56 point to cost, permitting or profit-taking concerns. The variable to watch is whether Chinese import premiums, firmed to US$48 to 55 per tonne, keep rising.
02 The board
The board shows a split between commodity exposure and producer equities. CPER’s 0.96% rise to US$39.91 tells one story; Southern Copper’s 2.32% fall to US$199.53 and Freeport-McMoRan’s 1.85% decline to US$72.56 tell another.
Futures respond to global demand signals, while miner shares also price in costs, permitting, community relations and profit-taking. On this session, the futures market was more optimistic than equity investors.
| Asset | Level | Change |
|---|---|---|
| Copper (CPER tracker) | US$39.91 | +0.96% |
| Southern Copper | US$199.53 | -2.32% |
| Freeport-McMoRan | US$72.56 | -1.85% |
Source: RT close, 2026-09-03. Where a commodity has no spot feed, an exchange-traded tracker or leading producer is shown as a labelled proxy.
Live Market IntelligenceThe live market board
Rio Times · Live Market Intelligence
Latin America — Cross-Market Board
| Instrument | Last | Change | YoY | Prev. | High | Low | Volume |
|---|---|---|---|---|---|---|---|
| IBOV | 205,430.33 | +0.54% | +21.85% | 204,324.26 | 168,310 | 167,142 | — |
| IPSA | 11,013.03 | +0.39% | — | 10,970.29 | 11,210 | 10,984 | 1,513,213,483 |
| IPC MEX | 68,929.72 | +1.87% | +12.17% | 67,663.29 | 66,121 | 65,405 | 108,886,187 |
| MERVAL | 2,848,945 | -0.35% | +30.51% | 3,022,485 | 3,042,365 | 2,991,150 | — |
| COLCAP | 2,566.28 | -0.55% | — | 9.04 | 9.05 | 9.02 | 4,133 |
| BVL PERÚ | 60,210.69 | -0.91% | — | — | — | — | — |
| USD/BRL | 5.16 | +0.01% | -5.13% | 5.16 | 5.18 | 5.14 | — |
| EUR/BRL | 5.95 | +1.01% | -5.83% | 5.89 | 5.98 | 5.94 | — |
| USD/MXN | 17.06 | -0.24% | -8.58% | 17.10 | 17.08 | 17.01 | — |
| USD/CLP | 913.98 | +0.04% | -5.67% | 913.65 | 915.11 | 906.68 | — |
| USD/COP | 3,140 | +0.03% | -22.04% | 3,139 | 3,141 | 3,105 | — |
| USD/PEN | 3.36 | -0.66% | -4.82% | 3.38 | 3.38 | 3.35 | — |
| USD/ARS | 1,493 | +0.10% | +12.96% | 1,491 | 1,494 | 1,480 | — |
| USD/UYU | 40.27 | +1.24% | +1.80% | 39.77 | 40.27 | 40.23 | — |
| USD/PYG | 5,939 | +1.68% | -19.54% | 5,841 | 5,939 | 5,925 | — |
| USD/BOB | 11.64 | -0.76% | +72.04% | 11.73 | 11.72 | 11.64 | — |
| USD/DOP | 58.34 | +1.25% | -3.44% | 57.62 | 58.34 | 58.04 | — |
| USD/CRC | 445.92 | +0.89% | -9.71% | 441.97 | 448.50 | 445.92 | — |
03 What moved it
China’s copper consumption is resilient but rotating. Property-related demand is shrinking, yet three engines are more than offsetting the loss: grid infrastructure, electric vehicles and renewables.
State Grid Corporation of China plans US$105 billion of grid investment in 2026, a 9% increase on 2025.
Ultra-high-voltage lines use 5 to 8 tonnes of copper per kilometre. They account for about 15% of Chinese copper demand, or 2.2 million tonnes a year.
China’s NEV production rose 22.4% year-on-year to 1.554 million units in May 2026, official data show. Battery electric vehicles use about 83 kg of copper each, versus 23 kg for combustion cars.
China’s National Energy Administration approved 280 GW of new solar and wind capacity for 2026, up 15% from 244 GW in 2025. That translates to roughly 1.3 million tonnes of incremental copper demand from the renewable build-out.
04 The Latin American read
Chile remains the world’s largest copper producer, and Peru ranks third after the Democratic Republic of Congo overtook it in 2023. Mine output and permitting decisions in both Andean countries still shape global supply.
For foreign investors watching Latin America, the lesson is durable, not cyclical. The region’s copper producers supply China’s electrification push and the wider energy transition.
Chinese refined copper imports rose 8% year-on-year in May to 346,000 tonnes. Yangshan import premiums firmed to US$48 to 55 per tonne, signalling durable Chinese physical demand.
05 The names to watch
CPER offers futures-based exposure, tracking the SummerHaven Copper Index via COMEX contracts. Its returns are influenced by the shape of the futures curve, including contango or backwardation during monthly rolls.
Southern Copper and Freeport-McMoRan are the large producers on our board. Their shares fell Thursday even as futures rose, testing whether equity investors catch up.
06 The outlook
Copper’s demand base is broadening beyond property into grid, EVs and renewables, but producer equities still need to prove execution.
Futures may hold their gains if Chinese import premiums stay firm and State Grid spending follows through. Miner shares could keep lagging if costs and permitting disappoint.
07 What to watch
- Chinese import premiums: Yangshan premiums at US$48 to 55 per tonne show physical demand strength; a further rise would confirm the futures move.
- State Grid spending: The planned US$105 billion investment for 2026 is a key demand driver; any acceleration would boost copper consumption.
- Chile and Peru policy: Permitting, community relations and mine output decisions will shape global supply from two of the world’s largest producers.
- CPER futures curve: The shape of COMEX contango or backwardation will affect CPER returns beyond the spot price direction.
Frequently Asked Questions
What is CPER?
CPER is the United States Copper Index Fund, an exchange-traded fund that tracks copper futures through COMEX contracts rather than holding physical copper.
Why did copper futures rise on Thursday?
Demand from China’s grid, EV and renewable sectors outweighed property weakness, with State Grid planning US$105 billion of grid investment in 2026.
Why did miner shares fall while CPER rose?
Southern Copper dropped 2.32% to US$199.53 and Freeport-McMoRan fell 1.85% to US$72.56, reflecting company-specific costs, permitting and profit-taking concerns.
Which Latin American countries matter most for copper?
Chile is the world’s largest copper producer and Peru ranks third, making their policy and mine output central to global supply.
Market data: RT
This article was produced by The Rio Times’ automated newsroom system. How we use AI · Report an error · Editorial responsibility: Matthias Camenzind, Editor-in-Chief
In depth
LatAm Markets: Live Signals → — real-time movers, turnover leaders and FX across Latin America.