Key Facts
- —What happened Copper futures slipped 0.11% to US$6.48 per pound on Thursday, August 20.
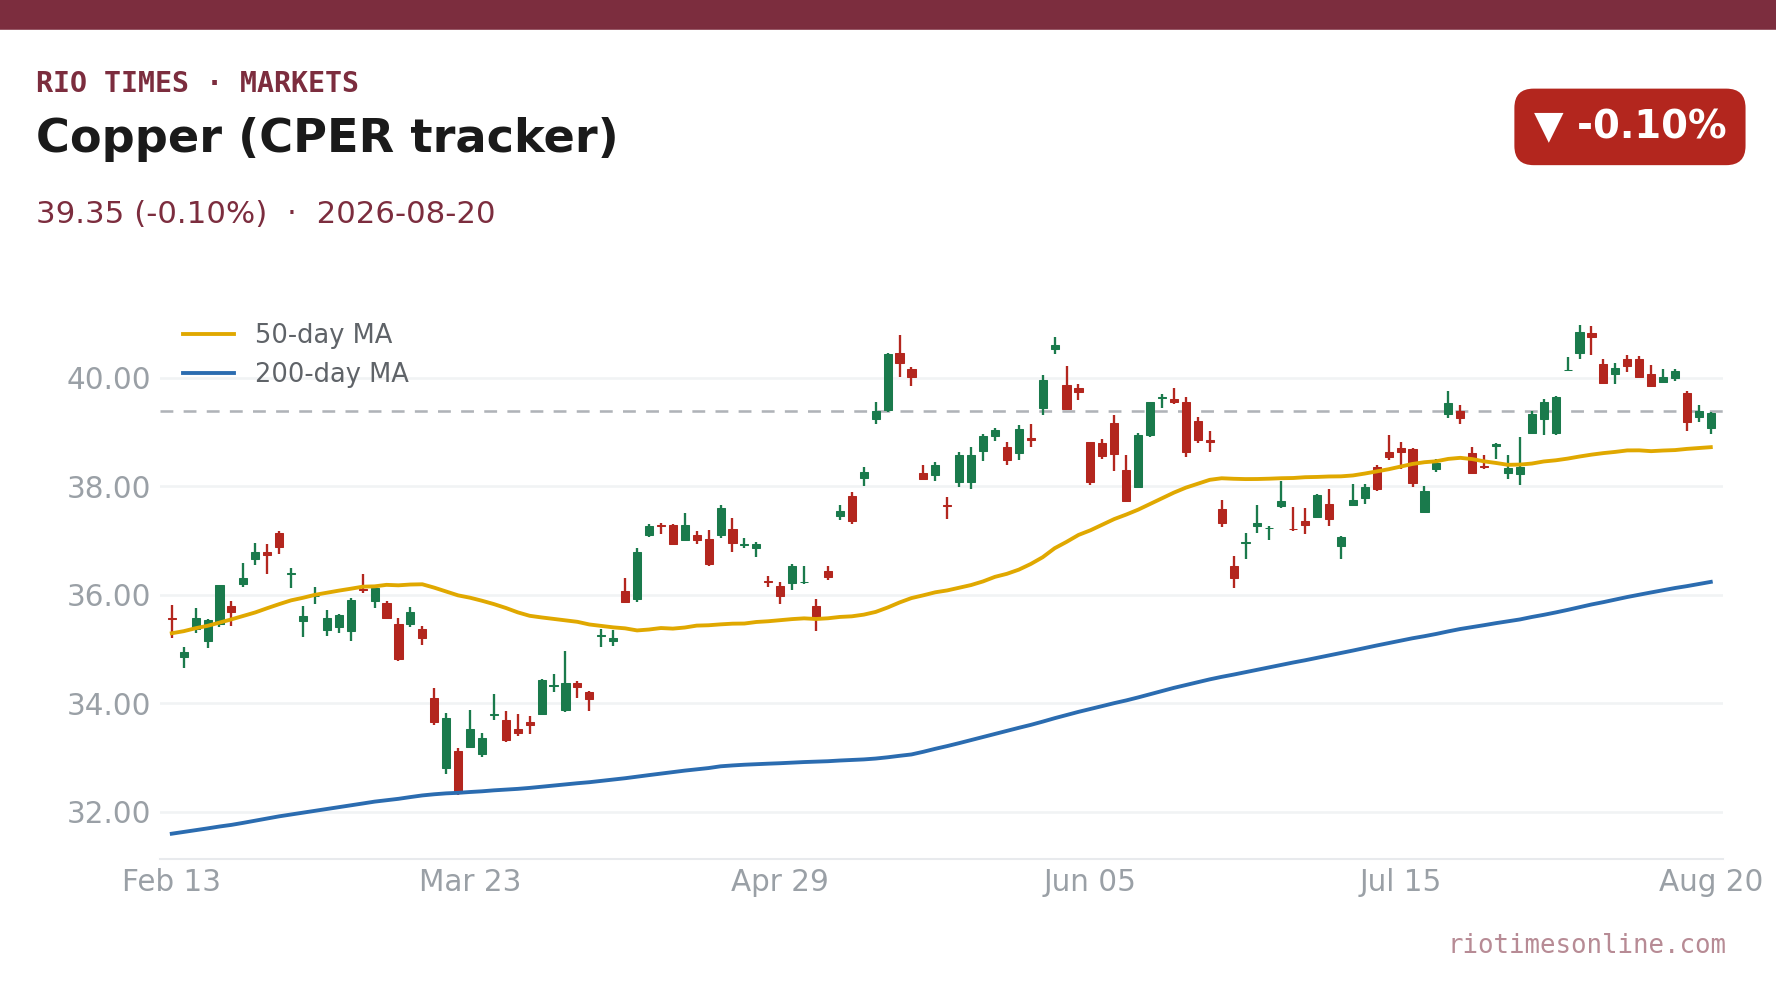
- —How big a jump The CPER fund tracking copper closed at US$39.35, down 0.10% for the day.
- —The real story Miner shares rose as copper fell, signaling longer-term supply tightness.
- —The catch Southern Copper gained 2.08% and Freeport-McMoRan 3.08% despite the metal’s drop.
- —Where it matters Chile and Peru supply over a third of world copper, keeping prices tied to Andean output.
- —What comes next The next J.P. Morgan Global Manufacturing PMI print will test demand trends.
Today’s Focus
Copper slipped on Thursday, August 20, with the global benchmark settling at US$6.48 per pound, down 0.11% from the previous session. The US-listed CPER fund, which tracks copper futures rather than physical metal, closed at US$39.35, a daily decline of 0.10%.
The move came as investors weighed strained Chilean mine output against softer global factory signals. Chile and Peru together supply more than a third of the world’s mined copper, keeping the market highly sensitive to supply news from the Andes.
Shares of the big miners moved in the opposite direction, with Southern Copper rising 2.08% to US$198.73 and Freeport-McMoRan up 3.08% to US$71.22. The disconnect between futures and producer shares suggests investors were positioning for longer-term supply tightness.
What matters today. The tension between strained Chilean supply and uncertain Chinese factory demand is the immediate driver, even as producers’ shares signal confidence in a longer structural deficit.
01 The session in one read
Copper eased on Thursday, August 20, giving back a sliver of the firmness built earlier in the month. The global futures-linked benchmark settled at US$6.48 per pound, a decline of 0.11% from the prior session.
The US-listed CPER fund, which holds copper futures rather than physical bars, closed at US$39.35, down 0.10% on the day. The move was small, but the context was not: supply strains in Chile and uncertain demand signals from China kept traders cautious.
The modest fall in the futures benchmark on Thursday, August 20 masks a deeper divergence: producers’ shares rose even as the metal slipped. That pattern points to investors pricing in tighter physical supply, led by Chile’s mixed June output, with Codelco down 4.8% but Escondida up 45.8%, while structural electrification demand continues to build. Watch the next J.P. Morgan Global Manufacturing PMI print as the single clearest test of whether softer factory activity, or the energy transition, sets copper’s next leg.
02 The board
The futures-tracking CPER fund settled at US$39.35, a 0.10% daily decline that translated the underlying market move into portfolio terms for foreign investors. Meanwhile, the big producer equities told a different story, with Southern Copper rising 2.08% to US$198.73.
Freeport-McMoRan gained 3.08% to US$71.22 on the same session. The divergence between a declining futures proxy and rallying miner shares suggests investors saw the day’s dip as a tactical pause rather than a reversal of the broader supply story.
| Asset | Level | Change |
|---|---|---|
| Copper (CPER tracker) | US$39.35 | -0.10% |
| Southern Copper | US$198.73 | +2.08% |
| Freeport-McMoRan | US$71.22 | +3.08% |
Source: RT close, 2026-08-20. Where a commodity has no spot feed, an exchange-traded tracker or leading producer is shown as a labelled proxy.
Live Market IntelligenceThe live market board
Rio Times · Live Market Intelligence
Latin America — Cross-Market Board
| Instrument | Last | Change | YoY | Prev. | High | Low | Volume |
|---|---|---|---|---|---|---|---|
| IBOV | 192,114.55 | +2.63% | +21.85% | 187,197.46 | 168,310 | 167,142 | — |
| IPSA | 10,916.57 | +0.08% | — | 10,908.18 | 11,210 | 10,984 | 1,513,213,483 |
| IPC MEX | 64,531.68 | +1.10% | +12.17% | 63,828.60 | 66,121 | 65,405 | 108,886,187 |
| MERVAL | 2,767,663 | +0.32% | +30.51% | 3,022,485 | 3,042,365 | 2,991,150 | — |
| COLCAP | 2,515.02 | -0.59% | — | 9.04 | 9.05 | 9.02 | 4,133 |
| BVL PERÚ | 59,751.67 | +0.18% | — | — | — | — | — |
| USD/BRL | 5.16 | +0.01% | -5.13% | 5.16 | 5.18 | 5.14 | — |
| EUR/BRL | 5.95 | +1.01% | -5.83% | 5.89 | 5.98 | 5.94 | — |
| USD/MXN | 17.06 | -0.24% | -8.58% | 17.10 | 17.08 | 17.01 | — |
| USD/CLP | 913.98 | +0.04% | -5.67% | 913.65 | 915.11 | 906.68 | — |
| USD/COP | 3,140 | +0.03% | -22.04% | 3,139 | 3,141 | 3,105 | — |
| USD/PEN | 3.36 | -0.66% | -4.82% | 3.38 | 3.38 | 3.35 | — |
| USD/ARS | 1,493 | +0.10% | +12.96% | 1,491 | 1,494 | 1,480 | — |
| USD/UYU | 40.27 | +1.24% | +1.80% | 39.77 | 40.27 | 40.23 | — |
| USD/PYG | 5,939 | +1.68% | -19.54% | 5,841 | 5,939 | 5,925 | — |
| USD/BOB | 11.64 | -0.76% | +72.04% | 11.73 | 11.72 | 11.64 | — |
| USD/DOP | 58.34 | +1.25% | -3.44% | 57.62 | 58.34 | 58.04 | — |
| USD/CRC | 445.92 | +0.89% | -9.71% | 441.97 | 448.50 | 445.92 | — |
03 What moved it
The session’s tone was set by fine-tuning of expectations around global factory activity. The J.P. Morgan Global Manufacturing PMI and China’s Caixin Manufacturing PMI are the two monthly indicators that most directly signal worldwide copper demand, and investors weighed the latest readings against the structural pull from electrification and AI infrastructure.
Chile’s June production, with Codelco down 4.8% year-on-year but Escondida up 45.8% and Collahuasi up 1.7%, reinforced the sense that supply is tighter than a casual glance at the benchmark would suggest. Peru’s output, by contrast, expanded in 2025, led by Southern Copper, Minera Las Bambas and Cerro Verde.
04 The Latin American read
Chile and Peru together account for more than a third of the world’s mined copper, with Chile at around 23% and Peru just under 12%. That concentration means even a mild single-session futures move such as Thursday’s 0.11% decline is inseparable from what is happening in the Andes.
For foreign investors watching Latin America, the key takeaway is that producer equities are pricing supply tightness while the futures benchmark is being held back by softer near-term factory signals. The gap between the two is the market’s way of saying the structural deficit is real but not yet fully reflected in spot pricing.
05 The names to watch
Southern Copper and Freeport-McMoRan are the two purest listed exposures to the Andean copper complex. Southern Copper is building Peru’s Tía María, permitted and targeted for first production around the turn of 2027, while Freeport runs Cerro Verde, the largest copper mine in Peru.
the Anglo American–Glencore Collahuasi joint venture in Chile and Antamina in Peru also feature prominently in supply news, with Glencore’s attributable share of Antamina output up 50% in the first half of 2026 on higher copper ore grades. State-owned Codelco remains the swing producer to watch on any sign of grade recovery in Chile.
06 The outlook
The copper market is caught between two powerful forces: strained supply in Latin America and uncertain but structurally underpinned demand from China’s factories and the global energy transition. Thursday’s modest dip in the futures benchmark did little to resolve that tension.
The immediate variable to watch is the next round of global manufacturing PMI data, which will show whether softer factory output is a blip or the beginning of a demand slowdown. Either way, the producer equity rally suggests many investors see the longer-term path for copper as higher, even if the futures curve continues to drift sideways in the near term.
07 What to watch
- Global manufacturing PMI: The next J.P. Morgan Global PMI print will test whether softer factory activity is a blip or a trend, directly shaping copper demand expectations.
- Codelco output recovery: Codelco’s June production fell 4.8% year-on-year; any sign of grade recovery in Chile could ease supply fears and pressure prices lower.
- Peru’s mine expansion: Peru consolidated output in 2025 led by Southern Copper, Las Bambas and Cerro Verde, and further gains could offset Chilean declines.
- China’s power infrastructure investment: Beijing’s spending on grid buildout and EV manufacturing remains the largest single demand driver for copper wiring and components.
Why did copper futures slip on Thursday, August 20?
The global benchmark settled at US$6.48 per pound, down 0.11%, as investors weighed softer global factory PMI signals against structural demand from electrification.
What is CPER and why does it matter?
CPER is the United States Copper Index Fund, the largest pure-play copper futures ETF in the US, holding near-month COMEX contracts rather than physical copper.
Why did miner shares rise while copper fell?
Southern Copper gained 2.08% and Freeport-McMoRan 3.08%, suggesting investors are pricing in long-term supply tightness even as near-term futures drift lower.
Which Latin American country produces the most copper?
Chile is the world’s number one producer, accounting for about 23% of global output in 2025, with Peru third at about 12%, behind the DRC.
This article was produced by The Rio Times’ automated newsroom system. How we use AI · Report an error · Editorial responsibility: Matthias Camenzind, Editor-in-Chief
In depth
LatAm Markets: Live Signals → — real-time movers, turnover leaders and FX across Latin America.
Read More from The Rio Times